Hi everyone, I would please like to set up a scanner to find stocks that have increased at least 10% from the previous day's close. I will be accessing the scanner when the market is closed. For example, I will be accessing the scanner on Tuesday at 9:00 p.m. and I would like to find stocks that have increased at least 10% from the market close on Monday (4:00 p.m.). May someone please help me with this? Thank you very much for your time and your help. @Joshua I have seen you post replies to scans previously, do you believe you would please be able to help with this? Thank you very much.
input Gain = 10;

def AggSec =
    GetaggregationPeriod() / 1000;
def Clock =
    SecondsFromTime(0000);
def Post =
    Between(Clock, 57600, 72000 - AggSec);
def Toggle =
    if !Toggle[1] and Post and !Post[1] then yes
    else if Toggle[1] and Post and !Post[1] then no
    else Toggle[1];
def End =
    !Post and Post[-1];
def PCA =
    if Toggle and End then Close
    else if !Toggle and End then Double.NaN
    else PCA[1];
def PCB =
    if !Toggle and End then Close
    else if Toggle and End then Double.NaN
    else PCB[1];
def PCX;
    if Toggle then {
        PCX = if end then PCB[1]
        else if Post then PCX[1]
        else double.nan;
    } else {
        PCX = if end then PCA[1]
        else if Post then...
Hi everyone, I would please like to set up a scanner to find stocks that have increased at least 10% from the previous day's close. I will be accessing the scanner when the market is closed. For example, I will be accessing the scanner on Tuesday at 9:00 p.m. and I would like to find stocks that have increased at least 10% from the market close on Monday (4:00 p.m.). May someone please help me with this? Thank you very much for your time and your help. @Joshua I have seen you post replies to scans previously, do you believe you would please be able to help with this? Thank you very much.
Thank you very much @SleepyZ, this is very good, however it does not include the current day's after hours session. The thinkscript you provided calculates the close from the previous day through the current day's close at 4:00 p.m. Is there anyway to calculate from the previous day's close to today at 8:00 p.m. when after hours ends? Thank you very much for your time and your help.
This should work for intraday with extended hours. I couldn't tell if you needed it to cut off at some point, so it goes from close to close. That can be easily modified if need be. There's some extra handlers for cheap illiquid stocks because you'll find a lot of that with this particular scan. The bottom part will help you visualize what's happening on a chart, but it won't interfere when scanning.
Code:
def isOpen =
    Between(GetTime(),
    RegularTradingStart(GetYYYYMMDD()),
    RegularTradingEnd(GetYYYYMMDD()));
def isLastBar =
    GetTime() == (RegularTradingEnd(GetYYYYMMDD()) - GetaggregationPeriod() + 1)
    or isOpen and !isOpen[-1]
    or (isOpen and GetDay() != GetDay()[-1]);
def PrevClose =
    if isLastBar then Close
    else PrevClose[1];
plot Scan =
    (Close - PrevClose) / PrevClose >= 0.10;
### for chart visual
def GetReced = PrevClose + 0; #fixes recursive variable error in addcloud
addcloud(GetReced  + (GetReced * 0.10), GetReced, color.white);
assignpriceColor(if Scan then color.blue else color.current);
addverticalLine(isLastBar);
Thank you very much for your help @Joshua, I really appreciate it. I would please like the scan to run from the close of regular market hours (4:00 p.m.) to the following day when after hours ends (8:00 p.m.). For example, I would like the scan to run from Tuesday at 4:00 p.m. to Wednesday at 8:00 p.m. May you please help me how I can modify the code you provided to work for this? Thank you very much for your help, I really appreciate it.
Between 4 and 8 this will function live. So, if you use a dynamic watch list, symbols will be added as they cross the threshold, and removed if they sink back in. Any symbols which remain valid at 8:00 will be remembered until the next market close, but anything after 8:00 will not change the results.
Code:
input Gain = 10;

def AggSec =
    GetaggregationPeriod() / 1000;
def Clock =
    SecondsFromTime(0000);
def Post =
    Between(Clock, 57600, 72000 - AggSec);
def End =
    !Post and Post[-1];
def prevClose =
    if End then Close
    else prevClose[1];
def Threshold =
    !End * (prevClose + (prevClose * (Gain * 0.01)));
def Breach =
    if End then no
    else if !End and Close > Threshold and Post then yes
    else if !End and !(Close > Threshold) and Post then no
    else Breach[1];
plot Scan = Breach;
Thank you very much for your help @Joshua. May you please tell me, what timeframe should this be set for? I have tried different timeframes and received different results. Thank you again Joshua.
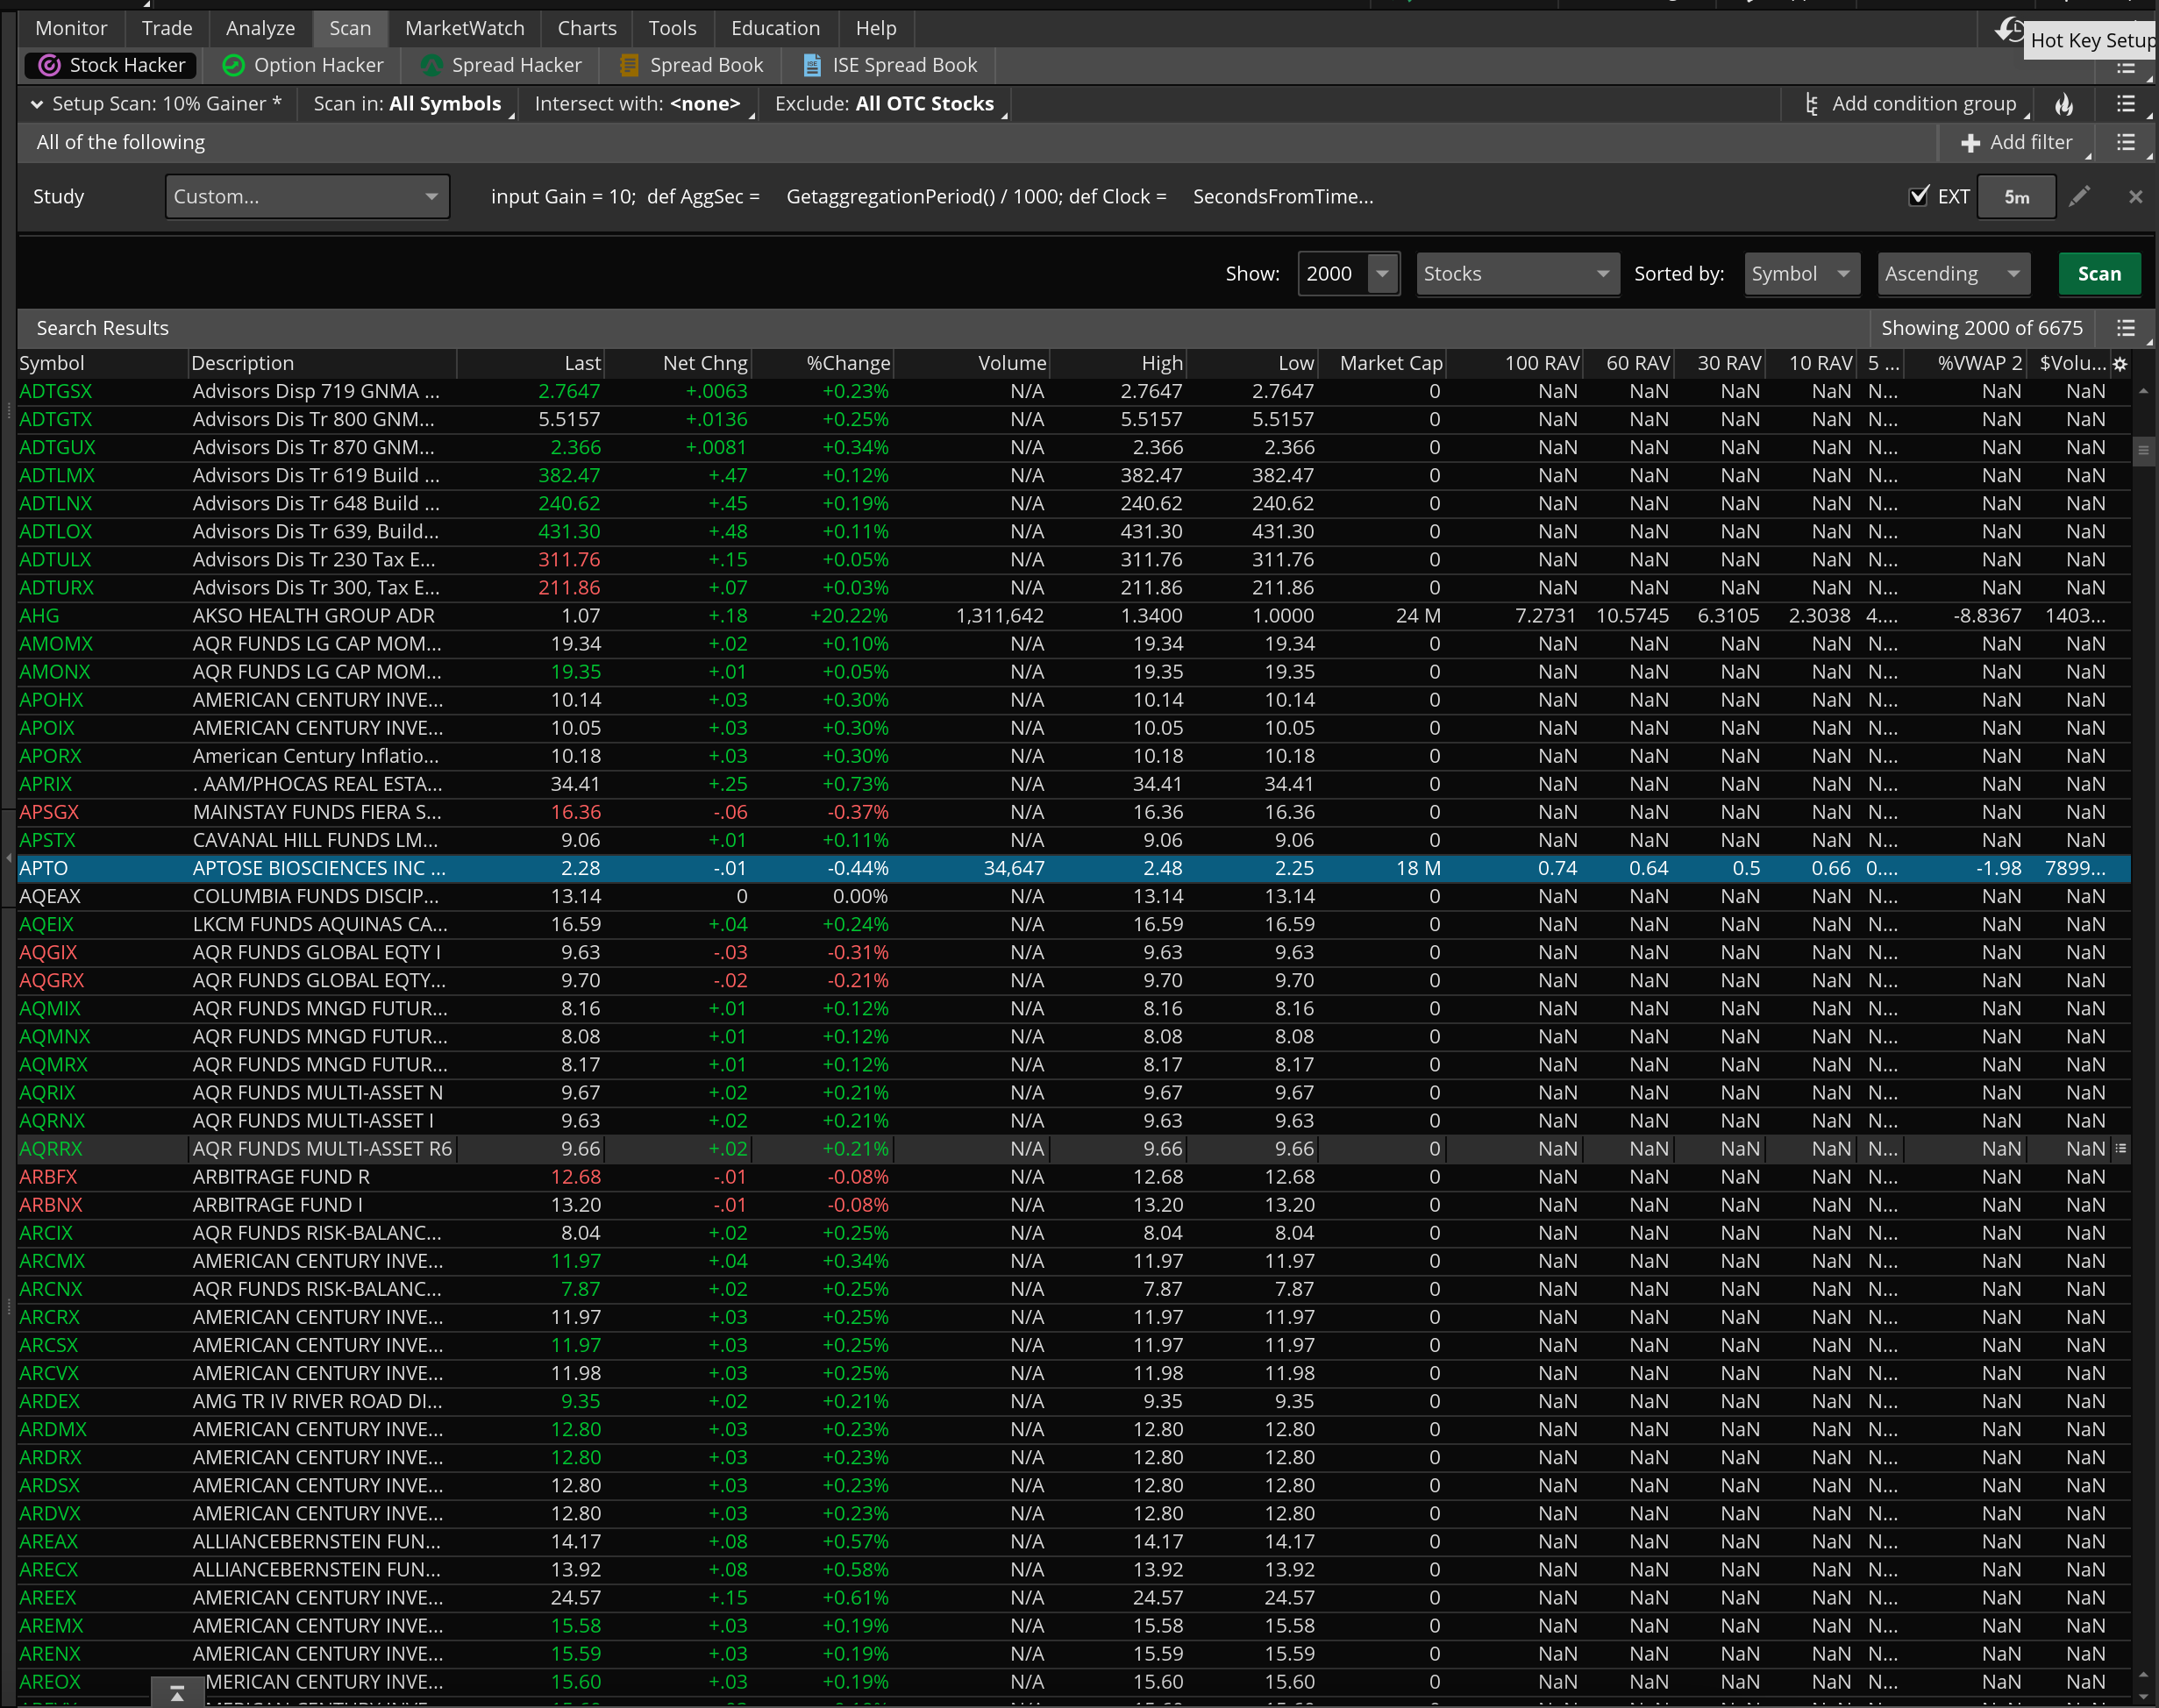
Thank you so much for all of your help @Joshua. I have tried to work with it, unfortunately the values do not seem to be computing properly. For example, in the scanner, the stock APTO appeared, which had a market closing price (4:00 p.m.) of 2.29 on January 11th, and then had a price of 2.33 on January 12th when after hours closed (8:00 p.m.). I just do not know why this stock appeared on the list even though this price increase is less than 10%. I have attached a screenshot below if that is helpful information. Thank you very much for all of your time and your help.
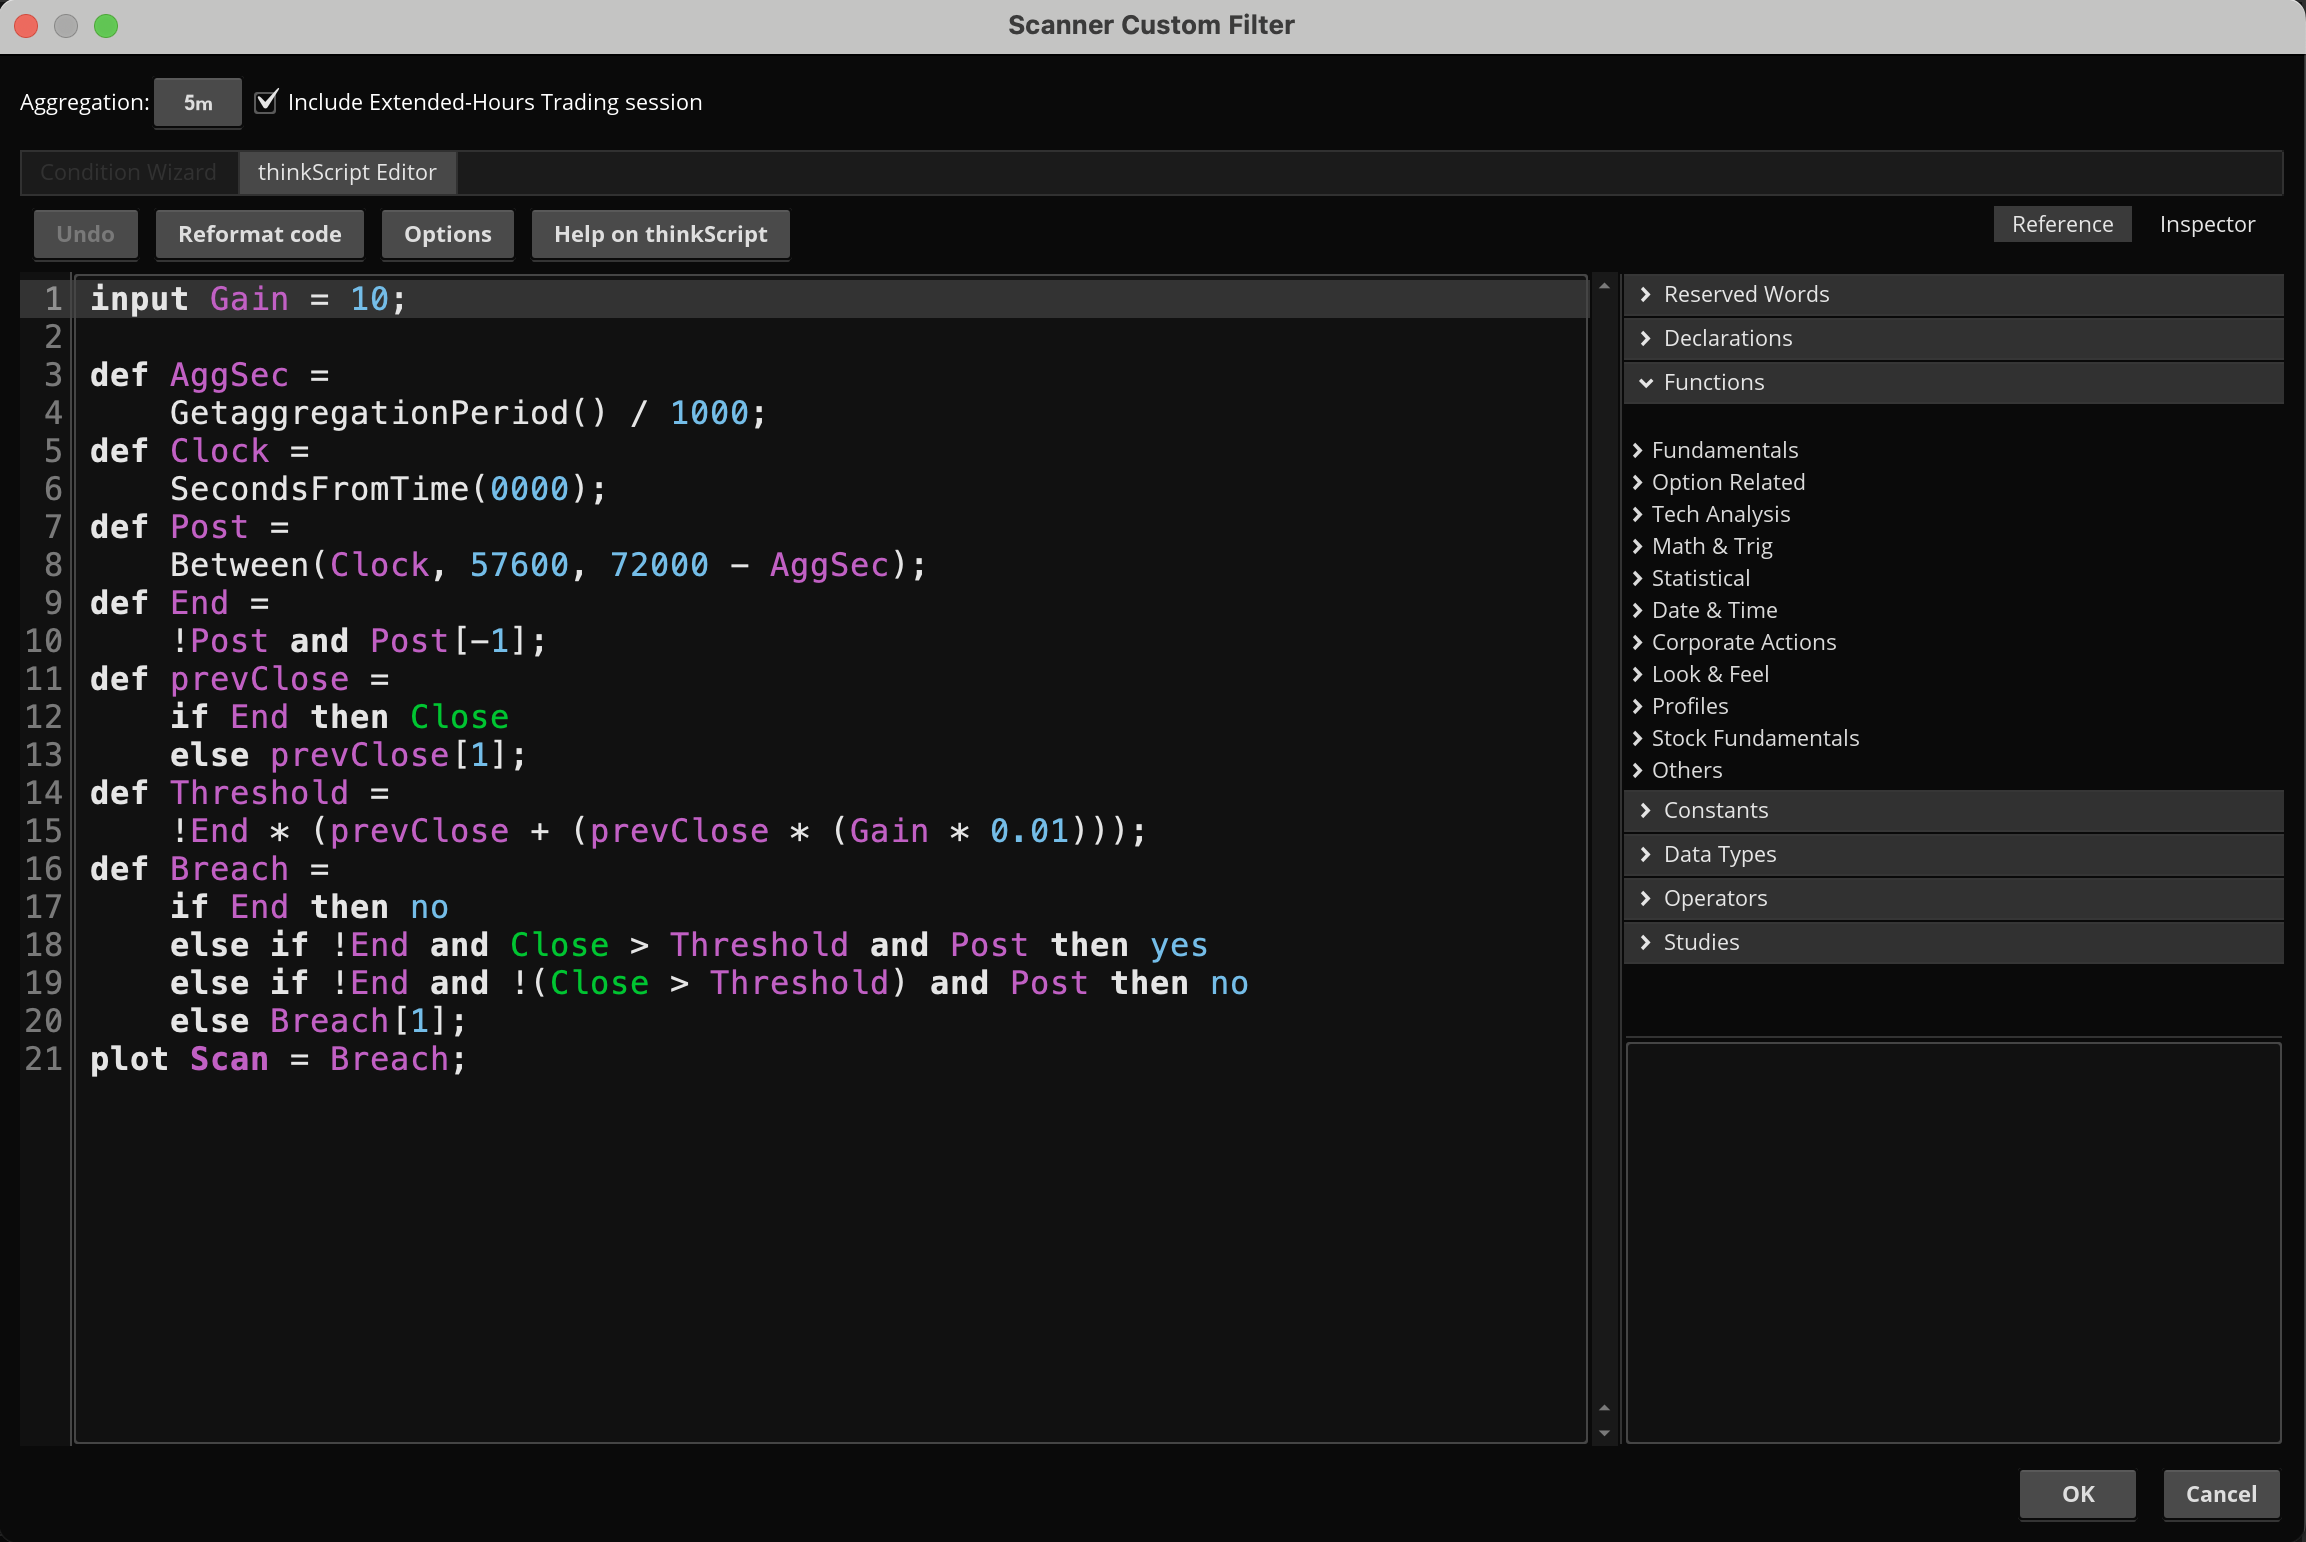
Oh ok, now I get it. Today's close all the way through tomorrow's post. The script I gave you is just today's close through today's post. I can fix that.
Oh ok, now I get it. Today's close all the way through tomorrow's post. The script I gave you is just today's close through today's post. I can fix that.
input Gain = 10;

def AggSec =
    GetaggregationPeriod() / 1000;
def Clock =
    SecondsFromTime(0000);
def Post =
    Between(Clock, 57600, 72000 - AggSec);
def Toggle =
    if !Toggle[1] and Post and !Post[1] then yes
    else if Toggle[1] and Post and !Post[1] then no
    else Toggle[1];
def End =
    !Post and Post[-1];
def PCA =
    if Toggle and End then Close
    else if !Toggle and End then Double.NaN
    else PCA[1];
def PCB =
    if !Toggle and End then Close
    else if Toggle and End then Double.NaN
    else PCB[1];
def PCX;
    if Toggle then {
        PCX = if end then PCB[1]
        else if Post then PCX[1]
        else double.nan;
    } else {
        PCX = if end then PCA[1]
        else if Post then PCX[1]
        else double.nan;
    };
def Check =
    if Post then (Close - PCX) / PCX > (Gain * 0.01)
    else Check[1];

plot Scan = Check;
Thank you very much for working on this @Joshua, I really appreciate it. When I input the code into the scanner, it will provide me with different results depending on the timeframe that I select. I will keep on working with this to see. Thank you very much again for offering your help, I really appreciate it.
Are you trading really cheap and illiquid stocks? It likely doing weird things where it carries over if no trades take place in the post market. I can add some extra handlers for that contingency, possibly others.
Are you trading really cheap and illiquid stocks? It likely doing weird things where it carries over if no trades take place in the post market. I can add some extra handlers for that contingency, possibly others.
Thank you very much for offering your help @Joshua. I am just using the scanner at approximately 10:00 p.m. at night. The only specification I put in place is that the stock has at least 100,000 in volume. Thank you very much for your help.
This should fix most of the issues with illiquidity. At that low of a volume threshold, which is then greatly exacerbated during extended hours, you're always going to find charts doing all sorts of weird things; skipping periods, skipping entire sessions, no post market trading at all, and so on. I don't think I've caught all of the strange things that can happen, but this should hopefully do for now.
Use the 5 or 15 minute agg. Any lower there aren't necessarily enough bars available to the scanner, anything larger and the bars begin to encapsulate the times being detected.
Code:
input Gain = 10;

def isOpen =
    Between(
        GetTime(),
        RegularTradingStart(GetYYYYMMDD()),
        RegularTradingEnd(GetYYYYMMDD())
    );
def isLastBar =
    GetTime() ==
        (RegularTradingEnd(GetYYYYMMDD())
        - GetAggregationPeriod() + 1)
    or (isOpen and !isOpen[-1])
    or (isOpen and GetDay() != GetDay()[-1]);
def NoPost =
    isOpen and isLastBar[1];
def AggSec =
    GetaggregationPeriod() / 1000;
def Clock =
    SecondsFromTime(0000);
def Post =
    Between(Clock, 57600, 72000 - AggSec);
def Toggle =
    if !Toggle[1] and Post and !Post[1] then yes
    else if Toggle[1] and Post and !Post[1] then no
    else Toggle[1];
def End =
    !Post and Post[-1];
def PCA =
    if noPost then double.NaN
    else if Toggle and End then Close
    else if !Toggle and End then Double.NaN
    else PCA[1];
def PCB =
    if noPost then double.NaN
    else if !Toggle and End then Close
    else if Toggle and End then Double.NaN
    else PCB[1];
def PCX;
    if Toggle then {
        PCX = if end then PCB[1]
        else if Post then PCX[1]
        else double.nan;
    } else {
        PCX = if end then PCA[1]
        else if Post then PCX[1]
        else double.nan;
    };
def Check =
    if noPost then No
    else if Post then ((Close - PCX) / PCX) > (Gain * 0.01)
    else Check[1];
plot Scan = Check == Yes;
useThinkScript is the #1 community of stock market investors using indicators and other tools to power their trading strategies. Traders of all skill levels use our forums to learn about scripting and indicators, help each other, and discover new ways to gain an edge in the markets.
How do I get started?
We get it. Our forum can be intimidating, if not overwhelming. With thousands of topics, tens of thousands of posts, our community has created an incredibly deep knowledge base for stock traders. No one can ever exhaust every resource provided on our site.
If you are new, or just looking for guidance, here are some helpful links to get you started.
VIP members get exclusive access to these proven and tested premium indicators: Buy the Dip, Advanced Market Moves 2.0, Take Profit, and Volatility Trading Range. In addition, VIP members get access to over 50 VIP-only custom indicators, add-ons, and strategies, private VIP-only forums, private Discord channel to discuss trades and strategies in real-time, customer support, trade alerts, and much more. Learn all about VIP membership here.
How can I access the premium indicators?
To access the premium indicators, which are plug and play ready, sign up for VIP membership here.