
mbarcala
Active member
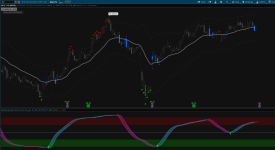
Here it's RSI Trend Indicator from Trading View converted to thinkscript. RSI Hull Trend is a hybrid indicator with RSI of HULL Signal. The Hull MA is combined with RSI to see if the Hull MA Buy/Sell Signal is in overbought or oversold condition. Buy Sell Signals are plotted based on settings of OB/OS or RSI. This indicator is very useful to see if the Trend is in Exhaustion or Beginning of a Trend.
Upper Indicator
https://usethinkscript.com/threads/break-keltner-bands-bkb-for-thinkorswim.11220/
photo
15580[/ATTACH]']

script
Upper Indicator
https://usethinkscript.com/threads/break-keltner-bands-bkb-for-thinkorswim.11220/
photo
15580[/ATTACH]']
script
Code:
# RSITrend by traderharikrishna converted by mbarcala for thinkorswim.com
# This source code is subject to the terms of the Mozilla Public License 2.0 at https://mozilla.org/MPL/2.0/
# https://www.tradingview.com/script/LvEWCt8I-RSI-Trend/

declare lower;

input rsiLengthInput = 14;
input rsiLengthInput2 = 28;
input trendlen = 45;
input show_Baseline = yes;
input oversold = 30;
input overbought = 70;

def BBMC = HullMovingAvg(close, trendlen);
def MHULL = BBMC[0];
def SHULL = BBMC[2];

def frsi = HullMovingAvg(rsi(price = close, length = rsiLengthInput),10);
def srsi = HullMovingAvg(rsi(price = close, length = rsiLengthInput2),10);

def hullrsi1 = rsi(price = MHULL, length = rsiLengthInput);
def hullrsi2 = rsi(price = SHULL, length = rsiLengthInput);

DefineGlobalColor("Up",CreateColor(77,195,255));
DefineGlobalColor("Dn",CreateColor(255,51,221));

plot hu1 = if show_Baseline then hullrsi1 else frsi;
hu1.AssignValueColor(if MHULL > SHULL then GlobalColor("Up") else
                     if MHULL < SHULL then GlobalColor("Dn") else Color.CURRENT);

plot hu2 = if show_Baseline then hullrsi2 else srsi;
hu2.AssignValueColor(if MHULL > SHULL then GlobalColor("Up") else
                     if MHULL < SHULL then GlobalColor("Dn") else Color.CURRENT);

AddCloud(hu1, hu2, GlobalColor("Up"), GlobalColor("Dn"));

plot buysignal = if MHULL crosses above SHULL then hu1 else Double.NaN;
buysignal.SetPaintingStrategy(PaintingStrategy.ARROW_UP);
buysignal.SetDefaultColor(Color.GREEN);
buysignal.SetLineWeight(2);
buysignal.HideBubble();
buysignal.HideTitle();

plot sellsignal = if MHULL crosses below SHULL then hu1 else Double.NaN;
sellsignal.SetPaintingStrategy(PaintingStrategy.ARROW_DOWN);
sellsignal.SetDefaultColor(Color.RED);
sellsignal.SetLineWeight(2);
sellsignal.HideBubble();
sellsignal.HideTitle();

plot mline = 50;
mline.SetDefaultColor(Color.GRAY);
mline.HideBubble();
mline.HideTitle();

def rsiUpperBand = overbought;
def rsiUpperBand2 = 90;
AddCloud(rsiUpperBand2, rsiUpperBand, CreateColor(148,0,0));

def rsiLowerBand = oversold;
def rsiLowerBand2 = 10;
AddCloud(rsiLowerBand, rsiLowerBand2, CreateColor(0,148,0));
Attachments
Last edited by a moderator:

