I believe that there is power in not only the value of an indicator, but also the colors we use to convey meaning and make it easy to glance at them to know quickly to how powerful a reading might be.
I have standardized on a color scheme using RGB computer codes. Red/Green/Blue, just like how computers use/combine colors to give us all the colors of the rainbow.
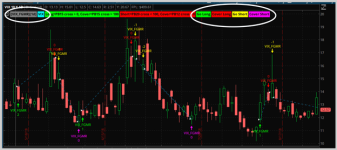
I also use a several different colors to differentiate long/short, entry/exit, and information.
Green - Buy to Open
Red – Sell to Close
Yellow – Sell to Open
Magenta – Buy to Close
Information – Gray or Cyan

Let’s take a look at two indicators in this post. A link below is also provided so you can import these into thinkorswim easily.

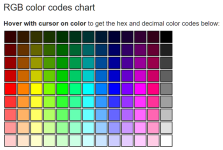
These colors go from red to yellow to green to blue to purple and magenta. You can find many examples of this on the web too. One example is this chart from rapidtables.com.

Creating your own colors in thinkscript
You can create custom colors in thinkscript on thinkorswim by using CreateColor. The 12 colors in the Moving Average Rainbow indicator are defined like
A1.SetDefaultColor(CreateColor(255,0,0)); # red
A2.SetDefaultColor(CreateColor(255,128,0));
A3.SetDefaultColor(CreateColor(255,255,0));
A4.SetDefaultColor(CreateColor(128,255,0));
A5.SetDefaultColor(CreateColor(0,255,0)); # green
A6.SetDefaultColor(CreateColor(0,255,128));
A7.SetDefaultColor(CreateColor(0,255,255));
A8.SetDefaultColor(CreateColor(0,128,255));
A9.SetDefaultColor(CreateColor(0,0,255)); # blue
AA.SetDefaultColor(CreateColor(128,0,255));
AB.SetDefaultColor(CreateColor(255,0,255));
AC.SetDefaultColor(CreateColor(255,0,128));
Final thoughts
I encourage you to think about how you use color when building your own indicators, and try to be consistent. This is not a strict rule, and this post is not meant to say there is only one way to do something. As always, use what makes sense, and use what works for you.
Code and Links
Here is the code for the two indicators and a link that will open a new flexgrid window which includes the screen above and the code.
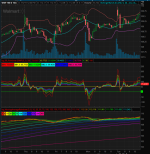
BB Rainbow – A Bollinger band percentage rainbow
Moving Average Rainbow – 12 moving averages from fast to slow
Link to flexible grid (flexgrid) with both indicators.
https://tos.mx/ZXQQ8X
I have standardized on a color scheme using RGB computer codes. Red/Green/Blue, just like how computers use/combine colors to give us all the colors of the rainbow.
I also use a several different colors to differentiate long/short, entry/exit, and information.
Green - Buy to Open
Red – Sell to Close
Yellow – Sell to Open
Magenta – Buy to Close
Information – Gray or Cyan
Let’s take a look at two indicators in this post. A link below is also provided so you can import these into thinkorswim easily.
These colors go from red to yellow to green to blue to purple and magenta. You can find many examples of this on the web too. One example is this chart from rapidtables.com.
Creating your own colors in thinkscript
You can create custom colors in thinkscript on thinkorswim by using CreateColor. The 12 colors in the Moving Average Rainbow indicator are defined like
A1.SetDefaultColor(CreateColor(255,0,0)); # red
A2.SetDefaultColor(CreateColor(255,128,0));
A3.SetDefaultColor(CreateColor(255,255,0));
A4.SetDefaultColor(CreateColor(128,255,0));
A5.SetDefaultColor(CreateColor(0,255,0)); # green
A6.SetDefaultColor(CreateColor(0,255,128));
A7.SetDefaultColor(CreateColor(0,255,255));
A8.SetDefaultColor(CreateColor(0,128,255));
A9.SetDefaultColor(CreateColor(0,0,255)); # blue
AA.SetDefaultColor(CreateColor(128,0,255));
AB.SetDefaultColor(CreateColor(255,0,255));
AC.SetDefaultColor(CreateColor(255,0,128));
Final thoughts
I encourage you to think about how you use color when building your own indicators, and try to be consistent. This is not a strict rule, and this post is not meant to say there is only one way to do something. As always, use what makes sense, and use what works for you.
Code and Links
Here is the code for the two indicators and a link that will open a new flexgrid window which includes the screen above and the code.
BB Rainbow – A Bollinger band percentage rainbow
Code:
#hint:<b>Bollinger Band (BB) Rainbow</b>\n\nPlots BB% (close) from lengths of 1 to 3.5 in 0.5 increments.\n\nColors range from red/yellows, through blues to magenta/pink respectively.

# Author: Kory Gill, @korygill
#
# Colors go from a natural rainbow coloring.
# See my Moving Average Rainbow study for a full
# list of 12 colors in a natural order.
#

script GetBollingerBandPercent
{
    input price = close;
    input upper = 2;
    input lower = -2;
    input averageType = AverageType.SIMPLE;
    input displace = 0;
    input length = 20;

    def upperBand = BollingerBands(price, displace, length, lower, upper, averageType).UpperBand;
    def lowerBand = BollingerBands(price, displace, length, lower, upper, averageType).LowerBand;

    plot BBPercent = (price - lowerBand) / (upperBand - lowerBand) * 100;
}

declare lower;

def price = close;
input averageType = AverageType.SIMPLE;
input displace = 0;
input length = 20;

def L1 = 1;
def L2 = 1.5;
def L3 = 2;
def L4 = 2.5;
def L5 = 3;
def L6 = 3.5;

plot B1 = GetBollingerBandPercent(price, L1, -L1);
plot B2 = GetBollingerBandPercent(price, L2, -L2);
plot B3 = GetBollingerBandPercent(price, L3, -L3);
plot B4 = GetBollingerBandPercent(price, L4, -L4);
plot B5 = GetBollingerBandPercent(price, L5, -L5);
plot B6 = GetBollingerBandPercent(price, L6, -L6);

plot ZeroLine = 0;
plot HalfLine = 50;
plot UnitLine = 100;
ZeroLine.SetDefaultColor(Color.GREEN);
HalfLine.SetDefaultColor(Color.YELLOW);
UnitLine.SetDefaultColor(Color.RED);

B1.SetdefaultColor(CreateColor(255,0,0));
B2.SetdefaultColor(CreateColor(255,255,0));
B3.SetdefaultColor(CreateColor(0,255,0));
B4.SetdefaultColor(CreateColor(0,255,255));
B5.SetdefaultColor(CreateColor(0,0,255));
B6.SetdefaultColor(CreateColor(255,0,128));

AddLabel(yes, "BB"+L1+": "+B1, B1.TakeValueColor());
AddLabel(yes, "BB"+L2+": "+B2, B2.TakeValueColor());
AddLabel(yes, "BB"+L3+": "+B3, B3.TakeValueColor());
AddLabel(yes, "BB"+L4+": "+B4, B4.TakeValueColor());
AddLabel(yes, "BB"+L5+": "+B5, B5.TakeValueColor());
AddLabel(yes, "BB"+L6+": "+B6, B6.TakeValueColor());
Moving Average Rainbow – 12 moving averages from fast to slow
Code:
#hint:<b>Moving Average Rainbow</b>\n\nPlots MAs (close) from lengths of 10 to 200.\n\nColors range from red/yellows, through blues to magenta/pink respectively.\n\nSquashing of the colors indicate MAs are getting ready to cross and change direction.\n\nConsistent spacing of the lines indicate a pattern in place and maintaining the trend.

# Author: Kory Gill, @korygill
#
# Colors go from a natural rainbow coloring.
# I like to always pick colors in this ordering when colorizing other indicators.
# This is also a great palette.
#

declare lower;

input Avg1 = 5;
input Avg2 = 8;
input Avg3 = 10;
input Avg4 = 20;
input Avg5 = 50;
input Avg6 = 75;
input Avg7 = 100;
input Avg8 = 125;
input Avg9 = 150;
input AvgA = 175;
input AvgB = 200;
input AvgC = 365;

plot A1 = Average(close, Avg1);
plot A2 = Average(close, Avg2);
plot A3 = Average(close, Avg3);
plot A4 = Average(close, Avg4);
plot A5 = Average(close, Avg5);
plot A6 = Average(close, Avg6);
plot A7 = Average(close, Avg7);
plot A8 = Average(close, Avg8);
plot A9 = Average(close, Avg9);
plot AA = Average(close, AvgA);
plot AB = Average(close, AvgB);
plot AC = Average(close, AvgC);

A1.SetDefaultColor(CreateColor(255,0,0));   # red
A2.SetDefaultColor(CreateColor(255,128,0));
A3.SetDefaultColor(CreateColor(255,255,0));
A4.SetDefaultColor(CreateColor(128,255,0));
A5.SetDefaultColor(CreateColor(0,255,0));   # green
A6.SetDefaultColor(CreateColor(0,255,128));
A7.SetDefaultColor(CreateColor(0,255,255));
A8.SetDefaultColor(CreateColor(0,128,255));
A9.SetDefaultColor(CreateColor(0,0,255));   # blue
AA.SetDefaultColor(CreateColor(128,0,255));
AB.SetDefaultColor(CreateColor(255,0,255));
AC.SetDefaultColor(CreateColor(255,0,128));

AddLabel(yes, Avg1, A1.TakeValueColor());
AddLabel(yes, Avg2, A2.TakeValueColor());
AddLabel(yes, Avg3, A3.TakeValueColor());
AddLabel(yes, Avg4, A4.TakeValueColor());
AddLabel(yes, Avg5, A5.TakeValueColor());
AddLabel(yes, Avg6, A6.TakeValueColor());
AddLabel(yes, Avg7, A7.TakeValueColor());
AddLabel(yes, Avg8, A8.TakeValueColor());
AddLabel(yes, Avg9, A9.TakeValueColor());
AddLabel(yes, AvgA, AA.TakeValueColor());
AddLabel(yes, AvgB, AB.TakeValueColor());
AddLabel(yes, AvgC, AC.TakeValueColor());
Link to flexible grid (flexgrid) with both indicators.
https://tos.mx/ZXQQ8X