RENKO charts extreme lagging behind Candle Charts and Last Price...

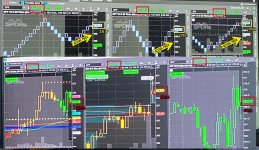
Hey guys, I'm having an issue I've been noticing the past couple of days and could be why it seems like I've been getting some pretty ****y order fills. I noticed, today worse than ever, my RENKO charts lagging behind candle charts and the last price by as long as approximately 30 seconds. The effect is periodic and seems to possibly occur when volume is higher on larger candlesticks. Eventually price on the RENKO does catch back up, but the effect is pretty much enough to make RENKO useless for trading/scalping. At times, today, there were price differences well over $1. (I snapped a couple crappy pics on my phone, see below)

Some things I was able to check while it occurred:
-This occurs whether or not RENKO or Candles are on the main FlexGrid screen or detached screens.
-None of my custom studies on the RENKO charts have the complexity warning icon
-The middle RENKO chart in my study below uses mostly different studies.
-PS I have realtime data connected :p
-Also I have 64gb of RAM and my Memory Usage is set at 8192-9152Mb

Here is my flexible chart grid: http://tos.mx/SsKkSnm

I contacted TOS support, but I was a bit late trying to figure out what was going on and prices had mostly corrected themselves by then. They were unable to witness it and mentioned I should try to restart my modem/router, which I did, but it seems to me that as the candles were providing the correct price, this shouldn't be an internet/connectivity issue- correct?

Any light you guys can shed or similar experiences, much appreciated- thanks

https://i.imgur.com/NQx2LIr.png[/img]']
NQx2LIr.png


16176[/ATTACH]']
FE7z8m7.jpg
 

Attachments

  • FE7z8m7.jpg
    FE7z8m7.jpg
    1.4 MB · Views: 393
Last edited:
Just an update-

Contacted Support again on Friday, and they were able to witness along with me, price fluctuations/differences between candlestick/last prices and renko price. He also said he saw that prices were off by a few points on his own personal range chart. He passed it along to their tech to look into it. I also contacted them once again this morning as prices were crazy off. I screen-recorded what was happening live and asked him to pass it along to the tech team. Here you can see how long the delay is while prices fluctuated to almost $2 off:


hopefully they find a fix for this, but I'm also curious if any of you guys are noticing this happening...
I am noticing this issue with tick charts as well. This morning was horrible. My experience was similar to yours. The majority of the traders in my group had significant issues today.
 
I am noticing this issue with tick charts as well. This morning was horrible. My experience was similar to yours. The majority of the traders in my group had significant issues today.
Sorry to hear that, but at least hopefully there are a lot of others out there making noise about this to Support. Watching back through my video, I timed the delay when candle prices broke back under $376 on SPY and it was a full minute and a half! My photos above were taken on last Monday when it was just this bad. During the week, it was off but wasn't nearly as bad when I was trying to show Support. Perhaps I'll quit trading on Mondays for now and be cautious during the week...
 
I run Renko charts myself; one thing I've done to mitigate these types of issues is increase the memory allocated to Think or Swim (plenty of YouTube videos and Reddit threads to walk you through this). You can also try hitting the HELP tab in the Think or Swim menu and then manually hitting the COLLECT GARBAGE button.
 
I have seen lagging on the SPY Renko/Range option contracts, but typically more so on the smaller volume contracts.
I have seen large bricks (25/50 on /es and spy) magically repaint themselves after being printed.
The bid/ask filter on the price setting for the range charts doesn't work for me ( only the LAST price data shows).
I get the impression that renko/range charts are something that TOS must have, but they only spent the minimum amount of time and $$ on creating them.
 
So I had an issue this morning where Finviz Elite was actually showing me prices that hadn't yet shown up on ToS chart or Active Trader ladder ($PRPL was @$5.12 on Finviz and on ToS it was still showing it @$5.09; hadn't broken the $5.10 mark on the Active Trader ladder yet)...this immediately drew my attention as Finviz Elite runs on a 10 second refresh rate, which means ToS was lagging more than 10 seconds. I reached out to support and was informed that the lag was being caused by an older version of ToS running in the background. They immediately fixed the issue, but when I asked if there was a way for me to fix the issue myself, I was told that the only way to have it taken care of is to reach out to them and have them do it. Personally, I think it's absolute BS; if their proprietary software doesn't work and function properly, perhaps it's time for a class action lawsuit...it's bad enough they're allowed to manipulate the market at will...now they want us to play from even further behind the 8 ball. Sad to say the least!
 
The lag I posted about seems to have mostly been fixed, but now I'm getting freeze ups across the board, where I can watch the prices change in realtime but all candles MTF, Renko/Range and Tick freeze randomly for as long as 30 or more seconds before giving me the correct visual. For instance the Renko box and price bubble will just freeze at a price then suddenly print 3 boxes, and the minute candles after having finished creating a candle will freeze for 30 seconds before showing the new candle and by that time the new candle's life is half over.

Trading Renko, I'm having to mark the price at which the trigger box will form, then ignore the chart completely and only watch the price. It's immensely frustrating. I've given myself lots of RAM and cleared the garbage, keep my pc up to date etc... no bueno. 64gb i9-9900k gaming rig :confused:
I've experienced the freezing issue as well, where everything on the chart just seems to stop, almost as if the symbol has been halted on a circuit breaker, then all the sudden it spits out 2-3 bars/bricks and adjusts the indicators and volume. I've also allocated as much RAM as possible and constantly clear the garbage (there are days I hammer the Collect Garbage button like I'm at the Whack-A-Mole World Championships). It's frustrating to say the least.
 
Was finally a bit fed up and contacted support this morning over the charts freezing. They said that sometimes the workspace file can become corrupt:


I have two thoughts on the potential reason because the error report does not indicate any specific rendering errors or anything. First I Would like to see if it is related to the workspace file because this is the most common reason we see this type of behavior happen. To test this, we can reset the workspace and test the performance in this reset state without loading any previously saved workspace.

Please start by saving the current workspace configuration in the 'Setup' menu in the upper right hand of the main thinkorswim window. Once saved, select reset workspace to default in the same setup window and test the chart responsiveness without reloading the previous workspace. If it works well then building a new workspace from the default file will be our best solution. When rebuilding the workspace you can reload watchlists, styles, grids, study sets, drawings, scans etc. Bringing back any previously saved configuration workspace file may bring back the slowness again and should not be reloaded. Custom scripted indicators can also cause corruptions in workspace files or have longer rendering times if added to the charts. Adding the custom scripts individually when rebuilding the workspace is the best way to isolate a particular script if that is the case.

I gave it a shot, resetting the workspace and individually loading saved flexible grids back up and into other detached windows. It so far has seemed to help. Its hard to tell because the open is when it freezes the worst, and by the time I started talking to the tech, the freezups had already started to lessen. So I guess I'll know if this really worked after open on Monday morning. Maybe it'll work for you guys also.
 
For the traders that are using Renko charts, are you still experiencing delays when volatility increases? Does anyone know any fix for this?
 
For the traders that are using Renko charts, are you still experiencing delays when volatility increases? Does anyone know any fix for this?

Personally, I have never seen a lag using Renko Bars and have done several stints trading with them... Ticks are ticks, the same ticks that cause candlesticks to move... That being said, I was just playing with a Renko Bar based chart earlier and will try monitoring it tomorrow...

Are you using a lot of indicators on the Chart, and are any overly complex...???
What tick$ or tick# did you think lag the most...???
Are you using a modified vmoptions file...???
Thank you for your reply, @rad14733! I had two charts open: on the left side I had the Renko chart set at 1D 25 Ticks and on the right side I had the Bar chart set at 1D 1 Min. The only indicator on both charts was a horizontal line to show the price level. Both charts were set to show the “last” price. As soon as the market opened (6:30 AM PT), volatility picked up and the Renko chart started to lag. Then, for instance, at 6:36:28 AM PT, the SPY was being quoted at $692.21 on the Renko chart and $691.90 on the Bar chart. The difference was so visible that there were times that the price line on the Renko chart was going up while, on the Bar chart, it was going down and vice versa. The lag then picked up on the Renko chart and it got to a point where the delay was greater than 2 min. Later in the day, I decided to watch the trading session for the SPY again but in a different computer. I then noticed that the same issued occurred when volatility picked up around 10:31 AM PT.

Do you happen to have any idea on how to fix the issue?
Good morning, @rad14733! I am not sure if you had the opportunity to watch the opening session for the SPY today and compare the Renko chart against the Bar chart. The discrepancy was even worse than yesterday. For instance, at 6:47:58 AM PT the Bar chart was quoting the SPY at $682.69 and the Renko chart was quoting at $683.60. A discrepancy of $0.91 and a lag more than one minute. This is huge if trading with leverage.
 
Good morning, @rad14733! I am not sure if you had the opportunity to watch the opening session for the SPY today and compare the Renko chart against the Bar chart. The discrepancy was even worse than yesterday. For instance, at 6:47:58 AM PT the Bar chart was quoting the SPY at $682.69 and the Renko chart was quoting at $683.60. A discrepancy of $0.91 and a lag more than one minute. This is huge if trading with leverage.

I have SxS Charts up with 3D 1m candles on the left and 3D 25$ tick on the right and they are synchronized almost perfectly a majority of the time with only fractional differences on occassion...

Again, are you using tick$ or tick# on your Renko Bar chart...??? I only use tick$ and won't test tick# unless that is what you are running as I am not familiar with tick# chart performance, although it should mirror price movement perfectly...

Ediited to add: If you are using true Renko Bars then you are using tick$ for your bars as tick# would be Range Bars rather than Renko Bars...

Still monitoring with little variation... I'm curious whether premarket makes a difference... I don't start watching charts until shortly before market open for RTH's at around 9:15am...
 
Last edited:
@rad14733, from my understanding, TOS has three types of “Aggregation”: Tick, Time, and Range. Under the “Range” type, we have two options: Range Bars and Renko Bars. My configuration is set for the Renko Bars with a time interval of 1 D and 25 Ticks (or $0.25).

Now, graphical configuration apart, what is bugging me is the fact that the price line does not synchronize between the Renko and Bar chart configuration when volatility picks up.

I will contact customer support to see what they have to say.

If you have any other insights please let me know.
 
@SHJ For volume and volatility spikes anything is possible... It could be that the added calculations for the Renko Bar block creations during fast price moves causes a bit more lag than for candlestick formations... Without seeing the underlying code it's hard to determine...

That being said, about a month or so back I entered a SPY Call trade right when I felt volatility was about to kick in... I clicked Buy Mkt to get in quick and as soon as the entry chime sounded it was immediately followed by another chime... I thought I had made a mistake but in reality the Option price spiked and hit my $0.40 Limit price so fast that neither the Active Trader ladder or the Option Chart beside it even moved... It was recorded as a 1 second trade... The trade was closed before either reacted to the price movement...S o with high volatility anything is possible...
Understood! Thank you for your additional insights. Wishing you a great weekend there.
 
The textbook states:
Renko is faster because it’s tick-driven.”
But on Thinkorswim:
  • Renko is synthetic
  • Tick flow is buffered
  • Rendering is single-threaded
  • Brick logic is recalculated from scratch
  • Volatility overwhelms the engine
So Renko becomes slower, not faster.

This is not a Renko problem.
It is a Thinkorswim architecture problem.
 
@SHJ Here is what a quick Google search spit out via AI...

Yes, market volatility can significantly affect the accuracy and reliability of Renko bar charts. While Renko charts are designed to filter out market "noise" and focus purely on price action, high volatility can lead to, or mask, inaccuracies in how those price movements are depicted.
NinjaTrader +3
Here is how market volatility impacts Renko chart accuracy:

1. Inaccurate Signals during High Volatility
  • Whipsawing: When volatility is extremely high (e.g., during news events), prices can swing back and forth rapidly, triggering "whipsaws." In these cases, Renko charts may create alternating red and green bricks rapidly, providing false reversal signals.
  • Delayed Information: Because Renko charts require a specific price movement to form a new brick, a sudden, massive price move in a high-volatility environment can mean a new brick doesn't print until much later, causing a significant lag compared to real-time price action.
  • Over-sensitivity: If the brick size is too small for the level of volatility, the chart will not accurately filter out the noise, resulting in a cluttered, less accurate representation of the trend.
    FOREX.com +4

2. Impact of Low Volatility
  • Missing Data: In very low-volatility, sideways, or inactive markets, Renko charts may not print new bricks for long periods. This can make the chart appear to freeze, making it difficult to gauge the current price accuracy or sentiment.
    Nunes Law, Inc +2

3. The "Repainting" or Lag Problem
  • Repainting Issues: Although not all, some Renko implementations can "repaint" or show a lag in signal generation, particularly when high volatility suddenly hits, causing a brick to form and then disappear if the price reverses before the close of that bar.
  • Misleading Trends: Because a new brick only forms after a specific price move, Renko charts might not accurately display the exact high or low of a fast-moving, volatile spike.
    LuxAlgo +4

How to Maintain Accuracy in Volatile Markets
  • Use ATR-Based Bricks: Instead of a fixed-point brick size, use Average True Range (ATR) based bricks. ATR automatically adjusts the brick size to reflect current market volatility, making the chart more responsive during high-volatility periods.
  • Increase Brick Size: During periods of high volatility, increase your brick size to filter out more noise.
  • Use Complementary Indicators: Combine Renko charts with other technical indicators (like moving averages or volume indicators) to confirm trends and avoid false signals.
    FOREX.com +3
Summary: While Renko charts are "cleaner" than candles, they are not immune to the effects of high volatility. They are excellent for filtering noise, but their accuracy is dependent on choosing a appropriate, volatility-adjusted brick size.

  • Renko Charts: A Simple Breakdown for Traders - LuxAlgo
    Apr 14, 2025 — Price vs Time Display. Renko charts work differently from traditional charts. Instead of showing price changes at regular time int...

  • How to Use Renko Charts in Stock Trading - FOREX.com SG
    Fixed value versus ATR * Fixed value: This sets the brick size to a fixed amount, such as $1, 10 points, or 15 pips, meaning the s...

  • Profitable Trading With Renko Charts
    Setting Up Renko Charts for Profitable Trading While Renko charts simplify price action, combining them with other technical indic...
Edited to add: As @BenTen described, Renko Bars as well as Heikin Ashi candlesticks are synthetic... If you think Renko Bars can present issues, try scalping using Heikin Ashi bars and see how fast you can blow up trades... I like Heikin Ashi candles for showing trend but when I used them for scalping I had disastrous results...
 

Join useThinkScript to post your question to a community of 21,000+ developers and traders.

Thread starter Similar threads Forum Replies Date
T Time's don't match on top and charts on ToS Playground 1

Similar threads

Not the exact question you're looking for?

Start a new thread and receive assistance from our community.

87k+ Posts
664 Online
Create Post

Similar threads

Similar threads

The Market Trading Game Changer

Join 2,500+ subscribers inside the useThinkScript VIP Membership Club
  • Exclusive indicators
  • Proven strategies & setups
  • Private Discord community
  • ‘Buy The Dip’ signal alerts
  • Exclusive members-only content
  • Add-ons and resources
  • 1 full year of unlimited support

Frequently Asked Questions

What is useThinkScript?

useThinkScript is the #1 community of stock market investors using indicators and other tools to power their trading strategies. Traders of all skill levels use our forums to learn about scripting and indicators, help each other, and discover new ways to gain an edge in the markets.

How do I get started?

We get it. Our forum can be intimidating, if not overwhelming. With thousands of topics, tens of thousands of posts, our community has created an incredibly deep knowledge base for stock traders. No one can ever exhaust every resource provided on our site.

If you are new, or just looking for guidance, here are some helpful links to get you started.

What are the benefits of VIP Membership?
VIP members get exclusive access to these proven and tested premium indicators: Buy the Dip, Advanced Market Moves 2.0, Take Profit, and Volatility Trading Range. In addition, VIP members get access to over 50 VIP-only custom indicators, add-ons, and strategies, private VIP-only forums, private Discord channel to discuss trades and strategies in real-time, customer support, trade alerts, and much more. Learn all about VIP membership here.
How can I access the premium indicators?
To access the premium indicators, which are plug and play ready, sign up for VIP membership here.
Back
Top