AlphaOptions
Member
do you know if this has been translated to TOS - https://www.tradingview.com/script/JWdrXD3I-RedK-Smooth-And-Lazy-Moving-Average-SALMA/
Last edited by a moderator:
Join useThinkScript to post your question to a community of 21,000+ developers and traders.
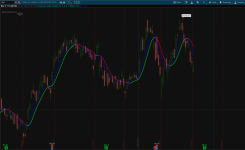
Here its a conversion to TOS of the RedK SmoothAndLazyMA or RedK SALMA, Enjoy! I work 98% of the time in Daily but 5 min chart is nice too!Great post. thank you. I saw in the image another RedK indicator so I looked on Tradingview - do you know if this has been translated to TOS - https://www.tradingview.com/script/JWdrXD3I-RedK-Smooth-And-Lazy-Moving-Average-SALMA/
# This source code is subject to the terms of the Mozilla Public License 2.0 at https://mozilla.org/MPL/2.0/
# RedKTrader v5
# RedK SmoothAndLazyMA - SALMA v2.0 converted to TOS by mbarcala
# Corrects price points within specific StdDev band before calculting a smoothed WMA

input length = 20;
input smooth = 5;
input mult = 0.3;
input sd_len = 1;
input matype = {default SMA, EMA, WMA};

def baseline = wma(close, sd_len);
def dev = mult * StDev(close, sd_len);
def upper = baseline + dev;
def lower = baseline - dev;
def cprice = if close > upper then upper else if close < lower then lower else close;

plot REMA = wma(wma(cprice, length), smooth);
REMA.AssignValueColor(if REMA > REMA[1] then Color.GREEN else Color.RED);
REMA.SetLineWeight(2);

plot type;
switch (matype) {
    case SMA:
        type = SimpleMovingAvg(close, length);
    case EMA:
        type = ExpAverage(close, length);
    case WMA:
        type = wma(close, length);
}
type.SetDefaultColor(Color.BLUE);
type.SetLineWeight(2);I check that this moving average has time delay compared with Hull moving average. Could you we add Hull moving average to your code by changing input matype = {default SMA, EMA, WMA, HULL}; ?Here its a conversion to TOS of the RedK SmoothAndLazyMA or RedK SALMA, Enjoy! I work 98% of the time in Daily but 5 min chart is nice too!
Photo
13584[/ATTACH]']
13586[/ATTACH]']
TOS Script
Code:# This source code is subject to the terms of the Mozilla Public License 2.0 at https://mozilla.org/MPL/2.0/ # RedKTrader v5 # RedK SmoothAndLazyMA - SALMA v2.0 converted to TOS by mbarcala # Corrects price points within specific StdDev band before calculting a smoothed WMA input length = 20; input smooth = 5; input mult = 0.3; input sd_len = 1; input matype = {default SMA, EMA, WMA}; def baseline = wma(close, sd_len); def dev = mult * StDev(close, sd_len); def upper = baseline + dev; def lower = baseline - dev; def cprice = if close > upper then upper else if close < lower then lower else close; plot REMA = wma(wma(cprice, length), smooth); REMA.AssignValueColor(if REMA > REMA[1] then Color.GREEN else Color.RED); REMA.SetLineWeight(2); plot type; switch (matype) { case SMA: type = SimpleMovingAvg(close, length); case EMA: type = ExpAverage(close, length); case WMA: type = wma(close, length); } type.SetDefaultColor(Color.BLUE); type.SetLineWeight(2);
Try this version here, I delete the first replay because I prefer to give you the 2 options in 1 indicator so you decide wish to use betterI check that this moving average has time delay compared with Hull moving average. Could you we add Hull moving average to your code by changing input matype = {default SMA, EMA, WMA, HULL}; ?
# This source code is subject to the terms of the Mozilla Public License 2.0 at https://mozilla.org/MPL/2.0/
# RedKTrader v5
# RedK SmoothAndLazyMA - SALMA v2.0 converted to TOS by mbarcala
# Corrects price points within specific StdDev band before calculting a smoothed WMA

input length = 20;
input smooth = 5;
input mult = 0.3;
input sd_len = 1;
input matype = {default SMA, EMA, WMA, HMA};
input maConfig = {default WMAD, WMAHull};

def baseline = wma(close, sd_len);
def dev = mult * StDev(close, sd_len);
def upper = baseline + dev;
def lower = baseline - dev;
def cprice = if close > upper then upper else if close < lower then lower else close;

plot REMA;
switch (maConfig) {
    case WMAD:
        REMA = WMA(WMA(cprice, length), smooth);
    case WMAHull:
        REMA = WMA(HullMovingAvg(cprice, length), smooth);
}

REMA.AssignValueColor(if REMA > REMA[1] then Color.GREEN else Color.RED);
REMA.SetLineWeight(2);

plot type;
switch (matype) {
    case SMA:
        type = SimpleMovingAvg(close, length);
    case EMA:
        type = ExpAverage(close, length);
    case WMA:
        type = wma(close, length);
    case HMA:
        type = HullMovingAvg(close, length);
}
type.SetDefaultColor(Color.BLUE);
type.SetLineWeight(2);I do not normally mention ways or methods on things that I haven't used or tested while I'm trading. The only I can say is that I saw that in 5 mins it could give you good runs and same for daily candle, especially for Daily in my opinion!Do you recommend using this with extended hours on or off?
Thanks! Could you share your strategy for using this? Buy green, sell red? What does the blue line indicate? Do you tend to use some types more than others? ex; SMA, HULL, etc?I do not normally mention ways or methods on things that I haven't used or tested while I'm trading. The only I can say is that I saw that in 5 mins it could give you good runs and same for daily candle, especially for Daily in my opinion!
Here a little description by the author!Thanks! Could you share your strategy for using this? Buy green, sell red? What does the blue line indicate? Do you tend to use some types more than others? ex; SMA, HULL, etc?
Great job. It is much better without time delay when Hull moving average is chosen.Try this version here, I delete the first replay because I prefer to give you the 2 options in 1 indicator so you decide wish to use better
new script
Code:# This source code is subject to the terms of the Mozilla Public License 2.0 at https://mozilla.org/MPL/2.0/ # RedKTrader v5 # RedK SmoothAndLazyMA - SALMA v2.0 converted to TOS by mbarcala # Corrects price points within specific StdDev band before calculting a smoothed WMA input length = 20; input smooth = 5; input mult = 0.3; input sd_len = 1; input matype = {default SMA, EMA, WMA, HMA}; input maConfig = {default WMAD, WMAHull}; def baseline = wma(close, sd_len); def dev = mult * StDev(close, sd_len); def upper = baseline + dev; def lower = baseline - dev; def cprice = if close > upper then upper else if close < lower then lower else close; plot REMA; switch (maConfig) { case WMAD: REMA = WMA(WMA(cprice, length), smooth); case WMAHull: REMA = WMA(HullMovingAvg(cprice, length), smooth); } REMA.AssignValueColor(if REMA > REMA[1] then Color.GREEN else Color.RED); REMA.SetLineWeight(2); plot type; switch (matype) { case SMA: type = SimpleMovingAvg(close, length); case EMA: type = ExpAverage(close, length); case WMA: type = wma(close, length); case HMA: type = HullMovingAvg(close, length); } type.SetDefaultColor(Color.BLUE); type.SetLineWeight(2);
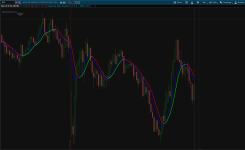
I made a following change to have a fast response to price changes.Great job. It is much better without time delay when Hull moving average is chosen.
Great Job!! a quick question, can someone here add candles color with this indicator? like paint the bars with the trend, meaning if the indicador is green paint the bar green and viceversa.. thank you very much or add a arrow for the signals.Here its a conversion to TOS of the RedK SmoothAndLazyMA or RedK SALMA, Enjoy! I work 98% of the time in Daily but 5 min chart is nice too!
Photo
13980[/ATTACH]']
13982[/ATTACH]']
TOS Script
Code:# This source code is subject to the terms of the Mozilla Public License 2.0 at https://mozilla.org/MPL/2.0/ # RedKTrader v5 # RedK SmoothAndLazyMA - SALMA v2.0 converted to TOS by mbarcala # Corrects price points within specific StdDev band before calculting a smoothed WMA input length = 20; input smooth = 5; input mult = 0.3; input sd_len = 1; input matype = {default SMA, EMA, WMA}; def baseline = wma(close, sd_len); def dev = mult * StDev(close, sd_len); def upper = baseline + dev; def lower = baseline - dev; def cprice = if close > upper then upper else if close < lower then lower else close; plot REMA = wma(wma(cprice, length), smooth); REMA.AssignValueColor(if REMA > REMA[1] then Color.GREEN else Color.RED); REMA.SetLineWeight(2); plot type; switch (matype) { case SMA: type = SimpleMovingAvg(close, length); case EMA: type = ExpAverage(close, length); case WMA: type = wma(close, length); } type.SetDefaultColor(Color.BLUE); type.SetLineWeight(2);
# This source code is subject to the terms of the Mozilla Public License 2.0 at https://mozilla.org/MPL/2.0/
# RedKTrader v5
# RedK SmoothAndLazyMA - SALMA v2.0 converted to TOS by mbarcala
# Corrects price points within specific StdDev band before calculting a smoothed WMA
# Mobius
# SuperTrend HeikenAshi
input length = 20;
input smooth = 5;
input mult = 0.3;
input sd_len = 1;
input matype = {default SMA, EMA, WMA, HMA};
input maConfig = {default WMAD, WMAHull};

def baseline = wma(close, sd_len);
def dev = mult * StDev(close, sd_len);
def upper = baseline + dev;
def lower = baseline - dev;
def cprice = if close > upper then upper else if close < lower then lower else close;

plot REMA;
switch (maConfig) {
    case WMAD:
        REMA = WMA(WMA(cprice, length), smooth);
    case WMAHull:
        REMA = WMA(HullMovingAvg(cprice, length), smooth);
}

REMA.AssignValueColor(if REMA > REMA[1] then Color.GREEN else Color.RED);
REMA.SetLineWeight(2);

plot type;
switch (matype) {
    case SMA:
        type = SimpleMovingAvg(close, length);
    case EMA:
        type = ExpAverage(close, length);
    case WMA:
        type = wma(close, length);
    case HMA:
        type = HullMovingAvg(close, length);
}
type.SetDefaultColor(Color.BLUE);
type.SetLineWeight(2);

input AtrMult = .70;
input nATR = 4;
input AvgType = AverageType.HULL;
input PaintBars = yes;
input BubbleOn = no;
input ShowLabel = no;
input AlertOn = no;
input PlotLine = no;

def HAopen;
def HAhigh;
def HAlow;
def HAclose;
HAopen = CompoundValue(1, (haopen[1] + haclose[1]) / 2, (open[1] + close) / 2);
HAhigh = Max(high, close[1]);
HAlow = Min(low, close[1]);
haclose = (HAopen + HAclose[1] + HAlow + close) / 4;
def v = volume;
def bar = barNumber();
def EOD = if SecondsTillTime(1545) == 0 and
             SecondsFromTime(1545) == 0
          then 1
          else 0;
def NotActive = if SecondsFromTime(1545) > 0
                then 1
                else 0;
def ATR = MovingAverage(AvgType, TrueRange(HAhigh, HAclose, HAlow), nATR);
def UP = HL2 + (AtrMult * ATR);
def DN = HL2 + (-AtrMult * ATR);
def ST = if close < ST[1]
         then Round(UP / tickSize(), 0) * tickSize()
         else Round(DN / tickSize(), 0) * tickSize();
plot SuperTrend = ST;
SuperTrend.SetHiding(!PlotLine);
SuperTrend.AssignValueColor(if close < ST then Color.RED else Color.GREEN);
SuperTrend.SetPaintingStrategy(PaintingStrategy.Line);
AssignPriceColor(if PaintBars and close < ST
                 then Color.RED
                 else if PaintBars and close > ST
                      then Color.GREEN
                      else Color.CURRENT);
plot ST_point = if isNaN(close[-1])
                then ST
                else double.nan;
ST_point.SetStyle(Curve.Points);
ST_point.SetLineWeight(3);
ST_point.SetDefaultColor(Color.Yellow);
# End Code SuperTrend HeikenAshi# This source code is subject to the terms of the Mozilla Public License 2.0 at https://mozilla.org/MPL/2.0/
# RedKTrader v5
# RedK SmoothAndLazyMA - SALMA v2.0 converted to TOS by mbarcala
# Corrects price points within specific StdDev band before calculting a smoothed WMA
#Impulse modified to use RMO Short Term and Long Term in confluence
#ImpulseRMOLST by Tradebyday
#https://usethinkscript.com/threads/trend-magic-indicator-for-thinkorswim.282/
input length = 20;
input smooth = 5;
input mult = 0.3;
input sd_len = 1;
input matype = {default SMA, EMA, WMA, HMA};
input maConfig = {default WMAD, WMAHull};
input length_a = 2;
input rmoLength = 81;
input swingTrdLen = 30;
input showRMO = no;
def baseline = wma(close, sd_len);
def dev = mult * StDev(close, sd_len);
def upper = baseline + dev;
def lower = baseline - dev;
def cprice = if close > upper then upper else if close < lower then lower else close;
plot REMA;
switch (maConfig) {
case WMAD:
REMA = WMA(WMA(cprice, length), smooth);
case WMAHull:
REMA = WMA(HullMovingAvg(cprice, length), smooth);
}
REMA.AssignValueColor(if REMA > REMA[1] then Color.GREEN else Color.RED);
REMA.SetLineWeight(2);
plot type;
switch (matype) {
case SMA:
type = SimpleMovingAvg(close, length);
case EMA:
type = ExpAverage(close, length);
case WMA:
type = wma(close, length);
case HMA:
type = HullMovingAvg(close, length);
}
type.SetDefaultColor(Color.BLUE);
type.SetLineWeight(2);
def agg = getAggregationPeriod();
def c = close(period = agg);
def h = high(period = agg);
def l = low(period = agg);
def pricedata = hl2(period = agg);
DefineGlobalColor("TrendUp", CreateColor(0, 254, 30));
DefineGlobalColor("TrendDown", CreateColor(255, 3, 2));
input lengthCCI = 50;
input lengthATR = 5;
input AtrFactor = 0.7;
def ATRcci = Average(TrueRange(h, c, l), lengthATR) * AtrFactor;
def price = c + l + h;
def linDev = LinDev(price, lengthCCI);
def CCI = if linDev == 0
then 0
else (price - Average(price, lengthCCI)) / linDev / 0.015;
def MT1 = if CCI > 0
then Max(MT1[1], pricedata - ATRcci)
else Min(MT1[1], pricedata + ATRcci);
plot data = MT1;
data.AssignValueColor(if c < MT1 then GlobalColor("TrendDown") else GlobalColor("TrendUp"));
def mva01 = MovingAverage( AverageType.SIMPLE, close, length_a );
def mva02 = MovingAverage( AverageType.SIMPLE, mva01, length_a );
def mva03 = MovingAverage( AverageType.SIMPLE, mva02, length_a );
def mva04 = MovingAverage( AverageType.SIMPLE, mva03, length_a );
def mva05 = MovingAverage( AverageType.SIMPLE, mva04, length_a );
def mva06 = MovingAverage( AverageType.SIMPLE, mva05, length_a );
def mva07 = MovingAverage( AverageType.SIMPLE, mva06, length_a );
def mva08 = MovingAverage( AverageType.SIMPLE, mva07, length_a );
def mva09 = MovingAverage( AverageType.SIMPLE, mva08, length_a );
def mva10 = MovingAverage( AverageType.SIMPLE, mva09, length_a );
def RMO = ( close - ( ( mva01 + mva02 + mva03 + mva04 + mva05 + mva06 + mva07 + mva08 + mva09 + mva10 ) / 10 ) ) / ( Highest( close, 10 ) - Lowest( close, 10 ) );
def Swingtrade = MovingAverage( AverageType.EXPONENTIAL, RMO, rmoLength );
def SwingTrd2 = MovingAverage( AverageType.EXPONENTIAL, RMO, swingTrdLen );
def SwingTrd3 = MovingAverage( AverageType.EXPONENTIAL, SwingTrd2, swingTrdLen );
def ZeroLine = 0;
def buy = if SwingTrd2 crosses above SwingTrd3 and SwingTrd3[0] > SwingTrd3[1] and SwingTrd3 > 0 then 1
else if SwingTrd3 crosses above 0 and SwingTrd3[0] > SwingTrd3[1] and SwingTrd3 > 0 then 1
else if SwingTrd2 crosses above 0 and SwingTrd3[0] > SwingTrd3[1] and SwingTrd3 > 0 then 1
else Double.NaN;
def sell = if SwingTrd2 crosses below SwingTrd3 and Swingtrade < 0 and Swingtrade[0] < Swingtrade[1] and low[0] < low[1] then 1
else if SwingTrd3 crosses below 0 and Swingtrade < 0 and Swingtrade[0] < Swingtrade[1] and low[0] < low[1] then 1
else if SwingTrd2 crosses below 0 and Swingtrade < 0 and Swingtrade[0] < Swingtrade[1] and low[0] < low[1] then 1
else Double.NaN;
def RMO2 = 100 * (close - ((Average(close, 2) +
Average(Average(close, 2), 2) +
Average(Average(Average(close, 2), 2), 2) +
Average(Average(Average(Average(close, 2), 2), 2), 2) +
Average(Average(Average(Average(Average(close, 2), 2), 2), 2), 2) +
Average(Average(Average(Average(Average(Average(close, 2), 2), 2), 2), 2), 2) +
Average(Average(Average(Average(Average(Average(Average(close, 2), 2), 2), 2), 2), 2), 2) +
Average(Average(Average(Average(Average(Average(Average(Average(close, 2), 2), 2), 2), 2), 2), 2), 2) +
Average(Average(Average(Average(Average(Average(Average(Average(Average(close, 2), 2), 2), 2), 2), 2), 2), 2), 2) +
Average(Average(Average(Average(Average(Average(Average(Average(Average(Average(close, 2), 2), 2), 2), 2), 2), 2), 2), 2), 2)) / 10)) /
(Highest(close, 10) - Lowest(close, 10));
def swingtrade4 = ExpAverage(RMO, 81);
def GreenPrice = Swingtrd2 > 0 and swingtrade4 > 0;
def RedPrice = Swingtrd2 < 0 and swingtrade4 < 0;
plot Bullish = GreenPrice;
plot Neutral = !GreenPrice and !RedPrice;
plot Bearish = RedPrice;
Bullish.SetDefaultColor(Color.UPTICK);
Bullish.SetPaintingStrategy(PaintingStrategy.BOOLEAN_POINTS);
Bullish.SetLineWeight(3);
Bullish.Hide();
Neutral.SetDefaultColor(Color.BLUE);
Neutral.SetPaintingStrategy(PaintingStrategy.BOOLEAN_POINTS);
Neutral.SetLineWeight(3);
Neutral.Hide();
Bearish.SetDefaultColor(Color.DOWNTICK);
Bearish.SetPaintingStrategy(PaintingStrategy.BOOLEAN_POINTS);
Bearish.SetLineWeight(3);
Bearish.Hide();
DefineGlobalColor("Bullish", Color.UPTICK);
DefineGlobalColor("Neutral", Color.BLUE);
DefineGlobalColor("Bearish", Color.DOWNTICK);
AssignPriceColor(if GreenPrice then GlobalColor("Bullish") else if RedPrice then GlobalColor("Bearish") else GlobalColor("Neutral"));@petergluis thank you very much for you help with this amazing indicator, very interesting the changes you have made.. i have one more question, i think the moving average changing color is the REMA i think, can you use that one to assign the bar colors, example when the REMA changes to green for bullish then the bar will be green colors and viceversa, i think will be better then the assign the bar color with the Super Trend, thank you very much in advance.
Ruby:# This source code is subject to the terms of the Mozilla Public License 2.0 at https://mozilla.org/MPL/2.0/ # RedKTrader v5 # RedK SmoothAndLazyMA - SALMA v2.0 converted to TOS by mbarcala # Corrects price points within specific StdDev band before calculting a smoothed WMA #Impulse modified to use RMO Short Term and Long Term in confluence #ImpulseRMOLST by Tradebyday #https://usethinkscript.com/threads/trend-magic-indicator-for-thinkorswim.282/ input length = 20; input smooth = 5; input mult = 0.3; input sd_len = 1; input matype = {default SMA, EMA, WMA, HMA}; input maConfig = {default WMAD, WMAHull}; input length_a = 2; input rmoLength = 81; input swingTrdLen = 30; input showRMO = no; def baseline = wma(close, sd_len); def dev = mult * StDev(close, sd_len); def upper = baseline + dev; def lower = baseline - dev; def cprice = if close > upper then upper else if close < lower then lower else close; plot REMA; switch (maConfig) { case WMAD: REMA = WMA(WMA(cprice, length), smooth); case WMAHull: REMA = WMA(HullMovingAvg(cprice, length), smooth); } REMA.AssignValueColor(if REMA > REMA[1] then Color.GREEN else Color.RED); REMA.SetLineWeight(2); plot type; switch (matype) { case SMA: type = SimpleMovingAvg(close, length); case EMA: type = ExpAverage(close, length); case WMA: type = wma(close, length); case HMA: type = HullMovingAvg(close, length); } type.SetDefaultColor(Color.BLUE); type.SetLineWeight(2); def agg = getAggregationPeriod(); def c = close(period = agg); def h = high(period = agg); def l = low(period = agg); def pricedata = hl2(period = agg); DefineGlobalColor("TrendUp", CreateColor(0, 254, 30)); DefineGlobalColor("TrendDown", CreateColor(255, 3, 2)); input lengthCCI = 50; input lengthATR = 5; input AtrFactor = 0.7; def ATRcci = Average(TrueRange(h, c, l), lengthATR) * AtrFactor; def price = c + l + h; def linDev = LinDev(price, lengthCCI); def CCI = if linDev == 0 then 0 else (price - Average(price, lengthCCI)) / linDev / 0.015; def MT1 = if CCI > 0 then Max(MT1[1], pricedata - ATRcci) else Min(MT1[1], pricedata + ATRcci); plot data = MT1; data.AssignValueColor(if c < MT1 then GlobalColor("TrendDown") else GlobalColor("TrendUp")); def mva01 = MovingAverage( AverageType.SIMPLE, close, length_a ); def mva02 = MovingAverage( AverageType.SIMPLE, mva01, length_a ); def mva03 = MovingAverage( AverageType.SIMPLE, mva02, length_a ); def mva04 = MovingAverage( AverageType.SIMPLE, mva03, length_a ); def mva05 = MovingAverage( AverageType.SIMPLE, mva04, length_a ); def mva06 = MovingAverage( AverageType.SIMPLE, mva05, length_a ); def mva07 = MovingAverage( AverageType.SIMPLE, mva06, length_a ); def mva08 = MovingAverage( AverageType.SIMPLE, mva07, length_a ); def mva09 = MovingAverage( AverageType.SIMPLE, mva08, length_a ); def mva10 = MovingAverage( AverageType.SIMPLE, mva09, length_a ); def RMO = ( close - ( ( mva01 + mva02 + mva03 + mva04 + mva05 + mva06 + mva07 + mva08 + mva09 + mva10 ) / 10 ) ) / ( Highest( close, 10 ) - Lowest( close, 10 ) ); def Swingtrade = MovingAverage( AverageType.EXPONENTIAL, RMO, rmoLength ); def SwingTrd2 = MovingAverage( AverageType.EXPONENTIAL, RMO, swingTrdLen ); def SwingTrd3 = MovingAverage( AverageType.EXPONENTIAL, SwingTrd2, swingTrdLen ); def ZeroLine = 0; def buy = if SwingTrd2 crosses above SwingTrd3 and SwingTrd3[0] > SwingTrd3[1] and SwingTrd3 > 0 then 1 else if SwingTrd3 crosses above 0 and SwingTrd3[0] > SwingTrd3[1] and SwingTrd3 > 0 then 1 else if SwingTrd2 crosses above 0 and SwingTrd3[0] > SwingTrd3[1] and SwingTrd3 > 0 then 1 else Double.NaN; def sell = if SwingTrd2 crosses below SwingTrd3 and Swingtrade < 0 and Swingtrade[0] < Swingtrade[1] and low[0] < low[1] then 1 else if SwingTrd3 crosses below 0 and Swingtrade < 0 and Swingtrade[0] < Swingtrade[1] and low[0] < low[1] then 1 else if SwingTrd2 crosses below 0 and Swingtrade < 0 and Swingtrade[0] < Swingtrade[1] and low[0] < low[1] then 1 else Double.NaN; def RMO2 = 100 * (close - ((Average(close, 2) + Average(Average(close, 2), 2) + Average(Average(Average(close, 2), 2), 2) + Average(Average(Average(Average(close, 2), 2), 2), 2) + Average(Average(Average(Average(Average(close, 2), 2), 2), 2), 2) + Average(Average(Average(Average(Average(Average(close, 2), 2), 2), 2), 2), 2) + Average(Average(Average(Average(Average(Average(Average(close, 2), 2), 2), 2), 2), 2), 2) + Average(Average(Average(Average(Average(Average(Average(Average(close, 2), 2), 2), 2), 2), 2), 2), 2) + Average(Average(Average(Average(Average(Average(Average(Average(Average(close, 2), 2), 2), 2), 2), 2), 2), 2), 2) + Average(Average(Average(Average(Average(Average(Average(Average(Average(Average(close, 2), 2), 2), 2), 2), 2), 2), 2), 2), 2)) / 10)) / (Highest(close, 10) - Lowest(close, 10)); def swingtrade4 = ExpAverage(RMO, 81); def GreenPrice = Swingtrd2 > 0 and swingtrade4 > 0; def RedPrice = Swingtrd2 < 0 and swingtrade4 < 0; plot Bullish = GreenPrice; plot Neutral = !GreenPrice and !RedPrice; plot Bearish = RedPrice; Bullish.SetDefaultColor(Color.UPTICK); Bullish.SetPaintingStrategy(PaintingStrategy.BOOLEAN_POINTS); Bullish.SetLineWeight(3); Bullish.Hide(); Neutral.SetDefaultColor(Color.BLUE); Neutral.SetPaintingStrategy(PaintingStrategy.BOOLEAN_POINTS); Neutral.SetLineWeight(3); Neutral.Hide(); Bearish.SetDefaultColor(Color.DOWNTICK); Bearish.SetPaintingStrategy(PaintingStrategy.BOOLEAN_POINTS); Bearish.SetLineWeight(3); Bearish.Hide(); DefineGlobalColor("Bullish", Color.UPTICK); DefineGlobalColor("Neutral", Color.BLUE); DefineGlobalColor("Bearish", Color.DOWNTICK); AssignPriceColor(if GreenPrice then GlobalColor("Bullish") else if RedPrice then GlobalColor("Bearish") else GlobalColor("Neutral"));
It will take a lot of time to do that. Someone else may help you fulfil your requirement.@petergluis thank you very much for you help with this amazing indicator, very interesting the changes you have made.. i have one more question, i think the moving average changing color is the REMA i think, can you use that one to assign the bar colors, example when the REMA changes to green for bullish then the bar will be green colors and viceversa, i think will be better then the assign the bar color with the Super Trend, thank you very much in advance.
It will take a lot of time to do that. Someone else may help you fulfil your requirement.Thank you very much peter!
Start a new thread and receive assistance from our community.
useThinkScript is the #1 community of stock market investors using indicators and other tools to power their trading strategies. Traders of all skill levels use our forums to learn about scripting and indicators, help each other, and discover new ways to gain an edge in the markets.
We get it. Our forum can be intimidating, if not overwhelming. With thousands of topics, tens of thousands of posts, our community has created an incredibly deep knowledge base for stock traders. No one can ever exhaust every resource provided on our site.
If you are new, or just looking for guidance, here are some helpful links to get you started.