Quarterly Value Area (TPO)

ziongotoptions

Active member
Code:
def poc = reference tpoProfile("price per row height mode" = "TICKSIZE", "time per profile" = "MONTH", "on expansion" = no, multiplier = 3).poc;
def vahigh = reference tpoProfile("price per row height mode" = "TICKSIZE", "time per profile" = "MONTH", "on expansion" = no, multiplier = 3).VAHigh;
def valow = reference tpoProfile("price per row height mode" = "TICKSIZE", "time per profile" = "MONTH", "on expansion" = no, multiplier = 3).VALow;

plot tpoc = poc[1];
plot tavahigh = vahigh[1];
plot tvalow = valow[1];

Hello I'm trying to script a code to calculate the quarterly VAH but I'm running into an issue, the script is calculating the Value Area for every three months not quarterly, any ideas on how to get the Quarterly VAH?
 
Solution
Thank you I’m sorry if I’m being a hassle I just want to plot the previous quarter value area on todays quarter , just as support resistance area I only really need to the lines, my system tells me if it’s above value area high , that’s initiative buying therefore trending behavior. So I really just want to plot the lines, hiding the profile works. I tried offsetting the profile by 1 but it plotted the previous quarter value area on the previous quarter, not on todays chart which is what I’m looking for

Here are the prior quarter and current quarter plotted on the current quarter's period.

Capture.jpg
Ruby:
input pricePerRowHeightMode = {default AUTOMATIC, TICKSIZE, CUSTOM};
input customRowHeight = 1.0;
input timePerProfile...
You can use this one for most timeframes with enough periods showing to plot the lines, but no hiding of prior period's profile. The current and prior period's TPO will plot on the current period though.
@SleepyZ could you post inputs to add the daily to the week, month, and Quart, this code is perfect just need the daily thanks
 

Join useThinkScript to post your question to a community of 21,000+ developers and traders.

the input for time frames only has 3 options to choose from.

Here is Day added to the limited selection script.

Also, edited the script above that does not have limited selections, but will plot the prior days code on that day extended to the current day rather than limited to just the lines extended to the current day. That script has the improved bubbles now. https://usethinkscript.com/threads/quarterly-value-area-tpo.9390/post-86049

Ruby:
#TPO Profile-Just Lines with Quarter Timeframe Added-Limited to Day, Week, Month and Quarter Timeframes
#Only Displays on the Current Timeframe Selected, the Current and Prior Timeframes
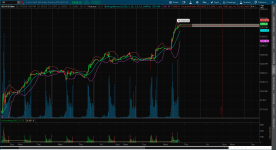
#Best Used on Daily and above charts or Intraday charts with at least 180 days displayed


script tpo {
    input pricePerRowHeightMode = {default AUTOMATIC, TICKSIZE, CUSTOM};
    input customRowHeight = 1.0;
    input timePerProfile = {CHART, MINUTE, HOUR, DAY, WEEK, MONTH, default QUARTER, "OPT EXP", BAR};
    input multiplier = 1;
    input onExpansion = no;
    input profiles = 2;
    input showPointOfControl = yes;
    input showValueArea = yes;
    input valueAreaPercent = 70;
    input opacity = 50;

    def period;
    def yyyymmdd = GetYYYYMMDD();
    def seconds = SecondsFromTime(0);
    def month = GetYear() * 12 + GetMonth();
    def day_number = DaysFromDate(First(yyyymmdd)) + GetDayOfWeek(First(yyyymmdd));
    def dom = GetDayOfMonth(yyyymmdd);
    def dow = GetDayOfWeek(yyyymmdd - dom + 1);
    def expthismonth = (if dow > 5 then 27 else 20) - dow;
    def exp_opt = month + (dom > expthismonth);
    def qtr = (GetMonth() - 1 ) % 3;
    def type = timePerProfile;

    switch (timePerProfile) {
    case CHART:
        period = 0;
    case MINUTE:
        period = Floor(seconds / 60 + day_number * 24 * 60);
    case HOUR:
        period = Floor(seconds / 3600 + day_number * 24);
    case DAY:
        period = CountTradingDays(Min(First(yyyymmdd), yyyymmdd), yyyymmdd) - 1;
    case WEEK:
        period = Floor(day_number / 7);
    case MONTH:
        period = Floor(month - First(month));
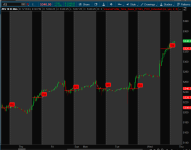
    case QUARTER:
        period = qtr == 0 and qtr[1] != 0;
    case "OPT EXP":
        period = exp_opt - First(exp_opt);
    case BAR:
        period = BarNumber() - 1;
}

    def count = CompoundValue(1, if period != period[1] then (count[1] + period - period[1]) % multiplier else count[1], 0);
    def cond = count < count[1] + period - period[1];
    def height;
    switch (pricePerRowHeightMode) {
    case AUTOMATIC:
        height = PricePerRow.AUTOMATIC;
    case TICKSIZE:
        height = PricePerRow.TICKSIZE;
    case CUSTOM:
        height = customRowHeight;
}

    profile tpo = TimeProfile("startNewProfile" = cond, "onExpansion" = onExpansion, "numberOfProfiles" = profiles, "pricePerRow" = height, "value area percent" = valueAreaPercent);
    def con = CompoundValue(1, onExpansion, no);
    def pc  = if IsNaN(tpo.GetPointOfControl()) and con then pc[1] else tpo.GetPointOfControl();
    def hVA = if IsNaN(tpo.GetHighestValueArea()) and con then hVA[1] else tpo.GetHighestValueArea();
    def lVA = if IsNaN(tpo.GetLowestValueArea()) and con then lVA[1] else tpo.GetLowestValueArea();

    def hProfile    = if IsNaN(tpo.GetHighest()) and con then hProfile[1] else tpo.GetHighest();
    def lProfile    = if IsNaN(tpo.GetLowest()) and con then lProfile[1] else tpo.GetLowest();
    def plotsDomain = IsNaN(close) == onExpansion;

    plot POC = if plotsDomain then pc else Double.NaN;
    plot VAH = if plotsDomain then hVA else Double.NaN;
    plot VAL = if plotsDomain then lVA else Double.NaN;
}


input timePerProfile = {DAY, WEEK, MONTH, default QUARTER};
def poc = tpo("time per profile" = timePerProfile);
def vah = tpo("time per profile" = timePerProfile).VAH;
def val = tpo("time per profile" = timePerProfile).VAL;

def ymd      = close(period = timePerProfile);
def candles  = !IsNaN(ymd);
def capture  = candles[1] and ymd != ymd[1] ;
def dayCount = CompoundValue(1, if capture then dayCount[1] + 1 else dayCount[1], 0);
def thisDay  = (HighestAll(dayCount) - dayCount ) ;

plot poc0 = if thisDay == 0 then poc else Double.NaN;
plot val0 = if thisDay == 0 then val else Double.NaN;
plot vah0 = if thisDay == 0 then vah else Double.NaN;

def pc1   = CompoundValue(1, if thisDay == 1 then poc else pc1[1] , poc);
plot poc1 = if thisDay == 0 then pc1 else Double.NaN;
def vh1   = CompoundValue(1, if thisDay == 1 then vah else vh1[1] , vah);
plot vah1 = if thisDay == 0 then vh1 else Double.NaN;
def vl1   = CompoundValue(1, if thisDay == 1 then val else vl1[1] , val);
plot val1 = if thisDay == 0 then vl1 else Double.NaN;

poc0.SetPaintingStrategy(PaintingStrategy.HORIZONTAL);
vah0.SetPaintingStrategy(PaintingStrategy.HORIZONTAL);
val0.SetPaintingStrategy(PaintingStrategy.HORIZONTAL);
poc1.SetPaintingStrategy(PaintingStrategy.DASHES);
vah1.SetPaintingStrategy(PaintingStrategy.DASHES);
val1.SetPaintingStrategy(PaintingStrategy.DASHES);
poc0.SetDefaultColor(Color.RED);
vah0.SetDefaultColor(Color.YELLOW);
val0.SetDefaultColor(Color.YELLOW);
poc1.SetDefaultColor(Color.RED);
vah1.SetDefaultColor(Color.YELLOW);
val1.SetDefaultColor(Color.YELLOW);


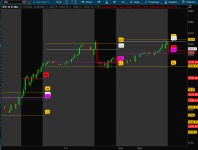
input showbubbles = yes;
input bubblemover = 2;
def b  = bubblemover;
def b1 = b + 1;
AddChartBubble(showbubbles and IsNaN(close[b]) and !IsNaN(close[b1]), poc[b1],
(if timePerProfile == timePerProfile.DAY then "D" else if timePerProfile == timePerProfile.WEEK then "W" else if timePerProfile == timePerProfile.MONTH then "M" else "Q") + "POC", Color.RED);
AddChartBubble(showbubbles and IsNaN(close[b]) and !IsNaN(close[b1]), val[b1], (if timePerProfile == timePerProfile.DAY then "D" else if timePerProfile == timePerProfile.WEEK then "W" else if timePerProfile == timePerProfile.MONTH then "M" else "Q") + "VAL", Color.YELLOW);
AddChartBubble(showbubbles and IsNaN(close[b]) and !IsNaN(close[b1]), vah[b1], (if timePerProfile == timePerProfile.DAY then "D" else if timePerProfile == timePerProfile.WEEK then "W" else if timePerProfile == timePerProfile.MONTH then "M" else "Q") + "VAH", Color.YELLOW);
AddChartBubble(showbubbles and IsNaN(close[b]) and !IsNaN(close[b1]), poc1[b1], (if timePerProfile == timePerProfile.DAY then "D" else if timePerProfile == timePerProfile.WEEK then "W" else if timePerProfile == timePerProfile.MONTH then "M" else "Q") + "POC1", Color.RED);
AddChartBubble(showbubbles and IsNaN(close[b]) and !IsNaN(close[b1]), val1[b1], (if timePerProfile == timePerProfile.DAY then "D" else if timePerProfile == timePerProfile.WEEK then "W" else if timePerProfile == timePerProfile.MONTH then "M" else "Q") + "VAL1", Color.YELLOW);
AddChartBubble(showbubbles and IsNaN(close[b]) and !IsNaN(close[b1]), vah1[b1], (if timePerProfile == timePerProfile.DAY then "D" else if timePerProfile == timePerProfile.WEEK then "W" else if timePerProfile == timePerProfile.MONTH then "M" else "Q") + "VAH1", Color.YELLOW);

input showlabels = yes;
AddLabel(showlabels, timePerProfile + " :  Current", Color.WHITE);
AddLabel(showlabels and poc, "POC " + AsText(poc), Color.RED);
AddLabel(showlabels and val, "VAL " + AsText(val), Color.YELLOW);
AddLabel(showlabels and vah, "VAH " + AsText(vah), Color.YELLOW);
AddLabel(showlabels, "  Prior : ", Color.WHITE);
AddLabel(showlabels and poc1, "POC1 " + AsText(poc1), Color.RED);
AddLabel(showlabels and val1, "VAL1 " + AsText(val1), Color.YELLOW);
AddLabel(showlabels and vah1, "VAH1 " + AsText(vah1), Color.YELLOW);
 
Last edited:
@SleepyZ is it possible to enhance this script to distinguish the trading hours for RTH vs Globex as an option for Futures? Overnight (6PM ET onwards to 930) are their own metrics and zones vs RTH for TPO/VWAP+StdDev/Pivots. Thanks so much for what you have already built here !
 
@SleepyZ is it possible to enhance this script to distinguish the trading hours for RTH vs Globex as an option for Futures? Overnight (6PM ET onwards to 930) are their own metrics and zones vs RTH for TPO/VWAP+StdDev/Pivots. Thanks so much for what you have already built here !
@SleepyZ Came across this thread recently and thought about our recent work together on the ETH Levels and wondered if what tifoji requested possible? I.e., can a version of this study be made that uses futures globex (18:00 - 9:29am ET) vs RTH as options for Period 0 and Period 1, and plots each of these sets separately (instead of plotting current selected period and previous selected period)? (If that is possible then I guess it would also even be possible to have selection options for the various sessions like London, Asia, NY, etc. which would also be amazing but the most important functionality would be futures globex vs. RTH.)

I can break this out to its own thread if you think that would work better!


Thanks man!!!

Here is the VolumeProfile RTHrs POC, based upon the hours input. Use this in conjuction with the other premarket futures scripts

The image shows non-extended and extended options. The TOS Volumeprofile indicator shows the Day's POC in white.
Screenshot 2024-05-15 160033.png
Code:
#VolumeProfile_Time_Basis_RTHrs_POC_Extended
input extend           = no;
input showpriorbubbles = yes;
input lineweight       = 2;
input bubblemover      = 0;

def   b  = bubblemover;
def   na = Double.NaN;

script reg {
    input daysback = 0;
    def na = Double.NaN;
    def bn = BarNumber();

#RTHhrs POC
    input start       = 0930;
    input end         = 1615;
    input extendlines = yes;

    def sec1          = SecondsFromTime(start);
    def sec2          = SecondsFromTime(end);
    def isTime1       = (sec1 >= 0 and sec1[1] <= 0) or
                        (sec1 < sec1[1] and sec1 > 0);
    def isTime2       = (sec2 > 0 and sec2[1] <= 0) or
                        (sec2 < sec2[1] and sec2 > 0) ;

    def aftermarket  = CompoundValue(1,
                       if isTime1[1] == 0 and isTime1 == 1
                       then 1
                       else if isTime2
                       then 0
                       else aftermarket[1], 0);

    def bars     = 100000;
    def ymd      = GetYYYYMMDD();
    def rth      = sec1 >= 0 and sec2 <= 0;
    def capture  = !IsNaN(close) and (ymd  and rth) != (ymd[1] and rth[1]);
    def dayCount = CompoundValue(1, if capture and rth then dayCount[1] + 1 else dayCount[1], 0);
    plot thisDay = HighestAll(dayCount) - dayCount  ;

    def period   = thisDay;
    def count    = CompoundValue(1,
                   if aftermarket and period != period[1]
                   then (count[1] + period - period[1]) % bars
                   else count[1], 0);
    def cond     = aftermarket != aftermarket[1];

    profile tpo  = TimeProfile("startNewProfile" = cond, "onExpansion" = no, "numberOfProfiles" = bars, pricePerRow = PricePerRow.TICKSIZE);

    def pPOC     = if aftermarket and IsNaN(tpo.GetHighest())
                   then pPOC[1]
                   else if period != period[1]
                   then tpo.GetPointOfControl()       
                   else pPOC[1];
    def exPOC    = if thisDay != thisDay[1] and thisDay == daysback
                   then if aftermarket
                        then pPOC
                        else exPOC[1]
                   else na;
    plot xPOC    = if !extendlines and  (thisDay > daysback or thisDay < daysback or !rth)
                   then na
                   else if extendlines and thisDay > daysback
                   then na
                   else HighestAll(exPOC);

} #End Script

plot rthp0 = if !extend and reg(0) < 0 then na else reg(0, extendlines = extend).xpoc;
plot rthp1 = if !extend and reg(1) < 1 then na else reg(1, extendlines = extend).xpoc;
plot rthp2 = if !extend and reg(2) < 2 then na else reg(2, extendlines = extend).xpoc;
plot rthp3 = if !extend and reg(3) < 3 then na else reg(3, extendlines = extend).xpoc;
plot rthp4 = if !extend and reg(4) < 4 then na else reg(4, extendlines = extend).xpoc;
plot rthp5 = if !extend and reg(5) < 5 then na else reg(5, extendlines = extend).xpoc;

#Colors
DefineGlobalColor("R", Color.RED);

rthp0.AssignValueColor(GlobalColor("R"));
rthp1.AssignValueColor(GlobalColor("R"));
rthp2.AssignValueColor(GlobalColor("R"));
rthp3.AssignValueColor(GlobalColor("R"));
rthp4.AssignValueColor(GlobalColor("R"));
rthp5.AssignValueColor(GlobalColor("R"));

rthp0.SetLineWeight(lineweight);
rthp1.SetLineWeight(lineweight);
rthp2.SetLineWeight(lineweight);
rthp3.SetLineWeight(lineweight);
rthp4.SetLineWeight(lineweight);
rthp5.SetLineWeight(lineweight);

#POC RTHrs

AddChartBubble(showpriorbubbles and !extend and IsNaN(rthp0[b]) and !IsNaN(rthp0[b + 1]), rthp0[b + 1], "TR", GlobalColor("R"));
AddChartBubble(showpriorbubbles and !extend and IsNaN(rthp1[b]) and !IsNaN(rthp1[b + 1]), rthp1[b + 1], "R1", GlobalColor("R"));
AddChartBubble(showpriorbubbles and !extend and IsNaN(rthp2[b]) and !IsNaN(rthp2[b + 1]), rthp2[b + 1], "R2", GlobalColor("R"));
AddChartBubble(showpriorbubbles and !extend and IsNaN(rthp3[b]) and !IsNaN(rthp3[b + 1]), rthp3[b + 1], "R3", GlobalColor("R"));
AddChartBubble(showpriorbubbles and !extend and IsNaN(rthp4[b]) and !IsNaN(rthp4[b + 1]), rthp4[b + 1], "R4", GlobalColor("R"));
AddChartBubble(showpriorbubbles and !extend and IsNaN(rthp5[b]) and !IsNaN(rthp5[b + 1]), rthp5[b + 1], "R5", GlobalColor("R"));


AddChartBubble(showpriorbubbles and IsNaN(close[b]) and !IsNaN(close[bubblemover + 1]), rthp0[b + 1], "TR", GlobalColor("R") );
AddChartBubble(showpriorbubbles and extend and IsNaN(close[b]) and !IsNaN(close[bubblemover + 1]), rthp1[b + 1], "R1", GlobalColor("R") );
AddChartBubble(showpriorbubbles and extend and IsNaN(close[b]) and !IsNaN(close[bubblemover + 1]), rthp2[b + 1], "R2", GlobalColor("R") );
AddChartBubble(showpriorbubbles and extend and IsNaN(close[b]) and !IsNaN(close[bubblemover + 1]), rthp3[b + 1], "R3", GlobalColor("R") );
AddChartBubble(showpriorbubbles and extend and IsNaN(close[b]) and !IsNaN(close[bubblemover + 1]), rthp4[b + 1], "R4", GlobalColor("R") );
AddChartBubble(showpriorbubbles and extend and IsNaN(close[b]) and !IsNaN(close[bubblemover + 1]), rthp5[b + 1], "R5", GlobalColor("R") );

#
 
I must be doing something wrong. I ran the script, then added a volumeprofile and this is the result. Sleepy, the I'm having trouble following the directions because it seems to be jumping back and forth. Would you please post a fully written version? Thanks for the hard work. I wish I could write in thinkscript :<
 

Attachments

  • 2024-05-15-FLEXIBLE_GRID.png
    2024-05-15-FLEXIBLE_GRID.png
    134.5 KB · Views: 9
I must be doing something wrong. I ran the script, then added a volumeprofile and this is the result. Sleepy, the I'm having trouble following the directions because it seems to be jumping back and forth. Would you please post a fully written version? Thanks for the hard work. I wish I could write in thinkscript :<

I am not sure what you have loaded on the chart that you posted.

The script in this link https://usethinkscript.com/threads/quarterly-value-area-tpo.9390/post-141726 was in response to @hboogie's request.

It is a fully developed script that works as intended. It plots the Regular Trading Hours VolumeProfile's POC for up to 6 days. More could be added, but I have not seen a need yet. Here is what the script looks like looks like on a /ES 10d30m chart


Here is link to the other script that @hboogie wanted that the above can be loaded with as 2 separate scripts. The image shows both scripts loaded.
 

Attachments

  • Screenshot 2024-05-15 175655.png
    Screenshot 2024-05-15 175655.png
    54.2 KB · Views: 10
  • Screenshot 2024-05-15 180453.png
    Screenshot 2024-05-15 180453.png
    61.8 KB · Views: 6
  • Screenshot 2024-05-15 175655.png
    Screenshot 2024-05-15 175655.png
    54.2 KB · Views: 7
Last edited:

Similar threads

Not the exact question you're looking for?

Start a new thread and receive assistance from our community.

87k+ Posts
337 Online
Create Post

Similar threads

Similar threads

The Market Trading Game Changer

Join 2,500+ subscribers inside the useThinkScript VIP Membership Club
  • Exclusive indicators
  • Proven strategies & setups
  • Private Discord community
  • ‘Buy The Dip’ signal alerts
  • Exclusive members-only content
  • Add-ons and resources
  • 1 full year of unlimited support

Frequently Asked Questions

What is useThinkScript?

useThinkScript is the #1 community of stock market investors using indicators and other tools to power their trading strategies. Traders of all skill levels use our forums to learn about scripting and indicators, help each other, and discover new ways to gain an edge in the markets.

How do I get started?

We get it. Our forum can be intimidating, if not overwhelming. With thousands of topics, tens of thousands of posts, our community has created an incredibly deep knowledge base for stock traders. No one can ever exhaust every resource provided on our site.

If you are new, or just looking for guidance, here are some helpful links to get you started.

What are the benefits of VIP Membership?
VIP members get exclusive access to these proven and tested premium indicators: Buy the Dip, Advanced Market Moves 2.0, Take Profit, and Volatility Trading Range. In addition, VIP members get access to over 50 VIP-only custom indicators, add-ons, and strategies, private VIP-only forums, private Discord channel to discuss trades and strategies in real-time, customer support, trade alerts, and much more. Learn all about VIP membership here.
How can I access the premium indicators?
To access the premium indicators, which are plug and play ready, sign up for VIP membership here.
Back
Top