Hello!
I'm new to ThinkScript. Thanks to artificial intelligence, I figured out some things, and some things I didn't.
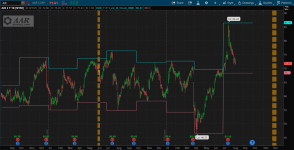
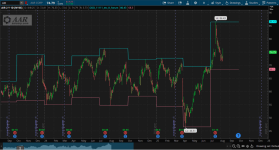
I hope someone can help me write a simple script to
automate the task of drawing simple horizontal lines
(highs and lows) that extend along the entire length of the
corresponding period - quarter (3,6,9,12).
(f) In detail:
If 1= before Friday or Friday, then the next Friday;
If 1= Saturday, then the next Friday = 1+12 (Sunday and 12 days);
If 1= Sunday, then the next Friday = +12 (12 days).
AggregationPeriod :
(f) 4H -> YTD
(f) 12H -> YTD
(f) 1 D -> YTD
1 W -> YTD
1 M -> YTD
Last relevant quarter :
the remaining bars to the actual bar and, accordingly,
the remaining future bars in the current quarter's plot.
code :
I'm new to ThinkScript. Thanks to artificial intelligence, I figured out some things, and some things I didn't.
I hope someone can help me write a simple script to
automate the task of drawing simple horizontal lines
(highs and lows) that extend along the entire length of the
corresponding period - quarter (3,6,9,12).
(f) In detail:
If 1= before Friday or Friday, then the next Friday;
If 1= Saturday, then the next Friday = 1+12 (Sunday and 12 days);
If 1= Sunday, then the next Friday = +12 (12 days).
AggregationPeriod :
(f) 4H -> YTD
(f) 12H -> YTD
(f) 1 D -> YTD
1 W -> YTD
1 M -> YTD
Last relevant quarter :
the remaining bars to the actual bar and, accordingly,
the remaining future bars in the current quarter's plot.
code :
Code:
# AggregationPeriod
#
def tf_now = GetAggregationPeriod() ;
#
def tf_4H = AggregationPeriod.FOUR_HOURS ;
# def tf_12H = AggregationPeriod.12_HOURS ;
def tf_day = AggregationPeriod.DAY ;
def tf_week = AggregationPeriod.WEEK ;
def tf_month = AggregationPeriod.MONTH ;
#
def is_tf_4H = ( tf_now == tf_4H ) ;
# def is_tf_12H = ( tf_now == tf_12H ) ;
def is_tf_day = ( tf_now == tf_day ) ;
def is_tf_week = ( tf_now == tf_week ) ;
def is_tf_month = ( tf_now == tf_month ) ;
#
def h = high ;
def l = low ;
def is_active = !IsNaN(h) and !IsNaN(l);
def na = Double.NaN;
def bn = BarNumber ();
def is_real_Bar = !IsNaN(close) and IsNaN(close[-1]); # lastBar
def real_Bar = if IsNaN(close[-1]) then bn else real_Bar [1]; # lastBar
# def numBars = HighestAll( is_real_Bar );
def current_Date = GetYYYYMMDD (); # current date
def current_D = GetDay (); # number current day
def current_W = GetWeek(); # number current week in year
def current_M = GetMonth(); # number current Month in year
def current_Y = GetYear(); # current Year
def current_D_M = GetDayOfMonth( current_Date ); # number day of month ( 1 .. 31 )
# secondFriday in Month of Quarter
def DayWeek = GetDayOfWeek( current_Date ); # number day of week
def secondFridayOffset =
if DayWeek <= 5 then 5 - DayWeek + 7
else
if DayWeek == 6 then
14 # Sat.
else
13 ; # Sun.
def is_Friday = GetDayOfWeek( current_Date ) == 5;
def Quarter_Date =
( current_M == 3 or current_M == 6 or current_M == 9 or current_M == 12 )
and
( current_D_M == secondFridayOffset )
;
# def is_Quarter = Quarter_Date != Quarter_Date [1] ; # ? = + 1 bar
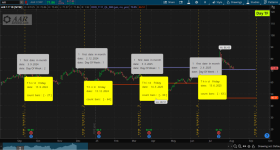
def Quarter_Bn = if Quarter_Date then Bn else Double.NaN;
# secondFridayOffset, day
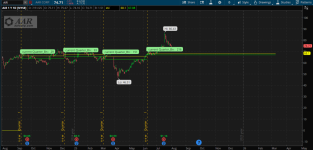
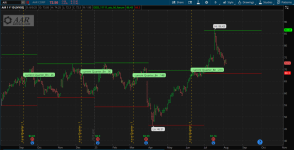
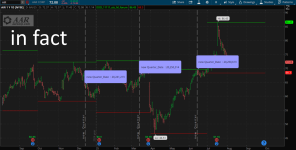
AddChartBubble( bn == Quarter_Bn , high, " current Quarter_Bn : " + Quarter_Bn , Color.LIGHT_GREEN , 1 );
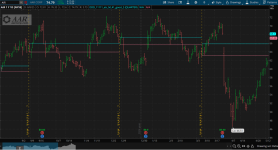
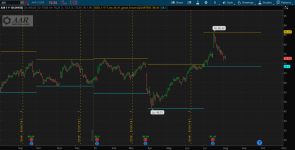
# plot High/Low
def Ql_High = if Quarter_Date then h else Ql_High[1] ;
def Ql_Low = if Quarter_Date then l else Ql_Low [1] ;
# High
plot q_High = Ql_High;
q_High.SetPaintingStrategy(PaintingStrategy.HORIZONTAL);
q_High.SetDefaultColor(Color.YELLOW);
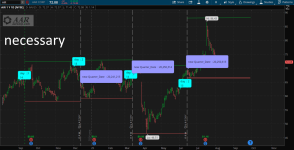
# Quartal Low
plot q_Low = Ql_Low;
q_Low.SetPaintingStrategy(PaintingStrategy.HORIZONTAL);
q_Low.SetDefaultColor(Color.GREEN);
# vertical Lines befor new Quartal
AddVerticalLine( (real_Bar <1) && Quarter_Date , " n e w Quarter : " + Quarter_Date , Color.ORANGE, Curve.SHORT_DASH);
# endAttachments
Last edited by a moderator:

")