Pullback after EMA Crossover

METAL

Active member
Plus
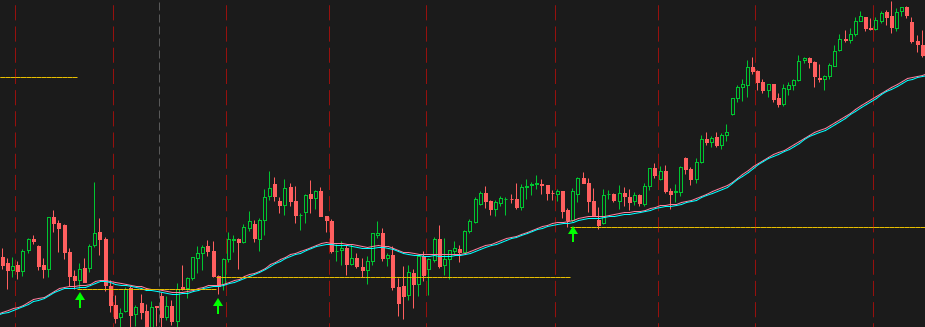
What I am trying to achieve, is when price crosses ema and then pulls back to within a certain range and then continues in the direction of the original cross. I would like an alarm and an arrow at this point.
Here is what I have started. It isn't working though.
also would like a stop low or high of last bar.
Code:
# Define inputs for the EMA period, pullback range, and candle criteria
input emaLength = 20;
input pullbackRange = 0.1;  # Adjust this value as needed for your criteria
input candleCriteria = 2;   # Number of candles to check after the pullback

# Calculate the EMA
def ema = ExpAverage(close, emaLength);

# Calculate the pullback level
def pullbackLevel = ema * (1 - pullbackRange);

# Define a condition for the crossover and pullback
def crossoverAndPullback = close crosses above ema and low <= pullbackLevel;

# Initialize a counter to track candles after pullback
def candlesAfterPullback = if crossoverAndPullback then 1 else candlesAfterPullback[1] + 1;

# Create a signal when the pullback condition is met for the specified number of candles
def signal = candlesAfterPullback >= candleCriteria;

# Plot arrows on the chart when the signal occurs
plot bullishSignal = signal;
bullishSignal.SetPaintingStrategy(PaintingStrategy.BOOLEAN_ARROW_UP);
bullishSignal.SetDefaultColor(Color.GREEN);
bullishSignal.SetLineWeight(2);

# Add an alert when the signal occurs
alert(signal, "Bullish Pullback Signal", Alert.BAR, Sound.Bell);
 

Attachments

  • EMA_Cross_Pullback.jpg
    EMA_Cross_Pullback.jpg
    100.6 KB · Views: 212
Solution
@METAL
xJM88gv.png

Ruby:
# Define inputs for the EMA period, pullback range, and candle criteria
input emaLength = 50;
input pullbackRange = 0.001;  # Adjust this value as needed for your criteria
input candleCriteria = 2;   # Number of candles to check after the pullback

# Calculate the EMA
plot ema = ExpAverage(close, emaLength);

# Calculate the pullback level
plot longpullbackLevel = ema + (ema - (ema * (1 - pullbackRange)));
plot shortpullbackLevel = ema - (ema - (ema * (1 - pullbackRange)));

# Define a condition for the crossover and pullback
def LongCrossover = if close crosses below ema then 0 else if low crosses above longpullbackLevel then 1 else LongCrossover[1];
def LongPullback = LongCrossover...
@METAL
xJM88gv.png

Ruby:
# Define inputs for the EMA period, pullback range, and candle criteria
input emaLength = 50;
input pullbackRange = 0.001;  # Adjust this value as needed for your criteria
input candleCriteria = 2;   # Number of candles to check after the pullback

# Calculate the EMA
plot ema = ExpAverage(close, emaLength);

# Calculate the pullback level
plot longpullbackLevel = ema + (ema - (ema * (1 - pullbackRange)));
plot shortpullbackLevel = ema - (ema - (ema * (1 - pullbackRange)));

# Define a condition for the crossover and pullback
def LongCrossover = if close crosses below ema then 0 else if low crosses above longpullbackLevel then 1 else LongCrossover[1];
def LongPullback = LongCrossover and low <= longpullbackLevel;

def ShortCrossover = if close crosses above ema then 0 else if high crosses below shortpullbackLevel then 1 else ShortCrossover[1];
def ShortPullback = ShortCrossover and high >= shortpullbackLevel;

# Initialize a counter to track candles after pullback
def longcandlesAfterPullback = if !LongCrossover then 0 else if LongPullback then longcandlesAfterPullback[1] + 1 else longcandlesAfterPullback[1];
def shortcandlesAfterPullback = if !ShortCrossover then 0 else if ShortPullback then shortcandlesAfterPullback[1] + 1 else shortcandlesAfterPullback[1];

# Create a signal when the pullback condition is met for the specified number of candles
def longsignal = longcandlesAfterPullback >= candleCriteria;
def shortsignal = shortcandlesAfterPullback >= candleCriteria;

# Plot arrows on the chart when the signal occurs
plot bullishSignal = longsignal and !longsignal[1];
bullishSignal.SetPaintingStrategy(PaintingStrategy.BOOLEAN_ARROW_UP);
bullishSignal.SetDefaultColor(Color.GREEN);
bullishSignal.SetLineWeight(2);

plot bearishSignal = shortsignal and !shortsignal[1];
bearishSignal.SetPaintingStrategy(PaintingStrategy.BOOLEAN_ARROW_DOWN);
bearishSignal.SetDefaultColor(Color.RED);
bearishSignal.SetLineWeight(2);

# Add an alert when the signal occurs
alert(longsignal, "Bullish Pullback Signal", Alert.BAR, Sound.Bell);
alert(shortsignal, "Bearish Pullback Signal", Alert.BAR, Sound.Bell);

def LongStop = if bullishSignal then Lowest(low,2) else LongStop [1];
plot LongStopPlot = LongStop;
LongStopPlot.SetPaintingStrategy(PaintingStrategy.HORIZONTAL);

def ShortStop = if bearishSignal then Highest(high,2) else ShortStop [1];
plot ShortStopPlot = ShortStop;
ShortStopPlot.SetPaintingStrategy(PaintingStrategy.HORIZONTAL);
 
Last edited:
Solution
@METAL
xJM88gv.png

Ruby:
# Define inputs for the EMA period, pullback range, and candle criteria
input emaLength = 50;
input pullbackRange = 0.001;  # Adjust this value as needed for your criteria
input candleCriteria = 2;   # Number of candles to check after the pullback

# Calculate the EMA
plot ema = ExpAverage(close, emaLength);
# Calculate the pullback level
plot pullbackLevel = ema + (ema - (ema * (1 - pullbackRange)));

# Define a condition for the crossover and pullback
def Crossover = if close crosses below ema then 0 else if low crosses above pullbackLevel then 1 else Crossover[1];
def Pullback = Crossover and low <= pullbacklevel;

# Initialize a counter to track candles after pullback
def candlesAfterPullback = if !Crossover then 0 else if Pullback then candlesAfterPullback[1] + 1 else candlesAfterPullback[1];

# Create a signal when the pullback condition is met for the specified number of candles
def signal = candlesAfterPullback >= candleCriteria;

# Plot arrows on the chart when the signal occurs
plot bullishSignal = signal and !signal[1];
bullishSignal.SetPaintingStrategy(PaintingStrategy.BOOLEAN_ARROW_UP);
bullishSignal.SetDefaultColor(Color.GREEN);
bullishSignal.SetLineWeight(2);

# Add an alert when the signal occurs
alert(signal, "Bullish Pullback Signal", Alert.BAR, Sound.Bell);

def Stop = if bullishSignal then low[1] else Stop [1];
plot StopPlot = Stop;
StopPlot.SetPaintingStrategy(PaintingStrategy.HORIZONTAL);
Wow. Thank You! I did not realize that there wasn't a short signal option. If you have time and do not mind, can you add that to this? I will attempt myself based on what you did to fix it.
 
@METAL
Added short signal to previous post.

@METAL
Added short signal to previous post.
I have some questions if you do not mind. Is there a way to make the stop line go to the lowest between the previous candle and the trigger candle?
By the way, So far this is crazy good on a 2 minute using 20 MA. As long as the next candle moves above the trigger candle. I have not lost on one trade with it yet. I have only used it 4 times so not a large sample. I will keep all posted. I also use the 50 EMA as a guide for trend. I am using it trading SPX but using spy.
 

Join useThinkScript to post your question to a community of 21,000+ developers and traders.

Similar threads

Not the exact question you're looking for?

Start a new thread and receive assistance from our community.

87k+ Posts
336 Online
Create Post

Similar threads

Similar threads

The Market Trading Game Changer

Join 2,500+ subscribers inside the useThinkScript VIP Membership Club
  • Exclusive indicators
  • Proven strategies & setups
  • Private Discord community
  • ‘Buy The Dip’ signal alerts
  • Exclusive members-only content
  • Add-ons and resources
  • 1 full year of unlimited support

Frequently Asked Questions

What is useThinkScript?

useThinkScript is the #1 community of stock market investors using indicators and other tools to power their trading strategies. Traders of all skill levels use our forums to learn about scripting and indicators, help each other, and discover new ways to gain an edge in the markets.

How do I get started?

We get it. Our forum can be intimidating, if not overwhelming. With thousands of topics, tens of thousands of posts, our community has created an incredibly deep knowledge base for stock traders. No one can ever exhaust every resource provided on our site.

If you are new, or just looking for guidance, here are some helpful links to get you started.

What are the benefits of VIP Membership?
VIP members get exclusive access to these proven and tested premium indicators: Buy the Dip, Advanced Market Moves 2.0, Take Profit, and Volatility Trading Range. In addition, VIP members get access to over 50 VIP-only custom indicators, add-ons, and strategies, private VIP-only forums, private Discord channel to discuss trades and strategies in real-time, customer support, trade alerts, and much more. Learn all about VIP membership here.
How can I access the premium indicators?
To access the premium indicators, which are plug and play ready, sign up for VIP membership here.
Back
Top