HighBredCloud
Well-known member
I wish there was an indicator that reads just like the Heikin Ashi candles but one that uses regular candle sticks for a more precise entry exit.
Last edited by a moderator:
Join useThinkScript to post your question to a community of 21,000+ developers and traders.
")
@vvcv I see what you mean now...I am a visual person so that helps out...But I am wondering if using other indicators such as True momentum indicator or even the SMIEUO would stack up to the 1 period SMA...I haven't tested a 1 SMA before but I think its very very sensitive unless this is used on higher timeframes such as 15 min if not greater...@HighBredCloud
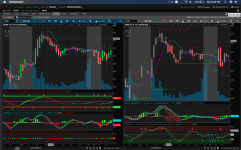
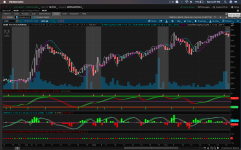
here are a couple of examples on the chart you posted. The image says 'no sorts' but should say no 'shorts'. Hope this give you a basic idea. It's a very 'paranoidy-conservative approach when i really want to lock in a good profit. The more the profit, the quicker i am to use this method.
@vvcv That's kind of how I trade...what time frame do you find the SMA priceline to work the best on? I typically try to trade the 15 min as the signal time frame then I enter on the 5 min for a more precise entry...,however, I feel that the SMA price line on the 5 min may be way too sensitive...@HighBredCloud
I've thought about that too. I should also mention that I do trade multiple times a day and very often i'm out of a move within 10 minutes. I jump in and as soon as I can, i move my stop to the entry price. At this point i move the stop up (like a automated trailing stop would do) and start looking for the price line (SMA) to drop below the HA. I don't think i would use this for any other type of trading, it's a quick in/out thesis for me.
# filename: MR__EZ_MACD_FREMA_
# original source: https://usethinkscript.com/threads/blast-off-indicator-for-thinkorswim.621/post-7785
# current source: https://usethinkscript.com/threads/adding-breakouts-and-dss-to-macd-indicator-for-thinkorswim.957/post-8463

# MACD with a more Normal Distribution
# Mobius
# V01.09.2015
#Hint: Plots a Gaussian distribution. If Normal Distribution is met, then at minimum, 68.2% of the close values should be inside a One Standard Deviation Envelope and 95.4% of the close values should be inside a 2 Standard Deviation Envelope.

# V11.01.2019 - netarchitech added standard TOS Breakout Signals per HighBredCloud request
# V11.01.2019 - netarchitech added Ehlers and Mobius Forward/Reverse EMA per HighBredCloud request
# V11.07.2019 - netarchitech added multiple Moving Average selection per HighBredCloud request
# V11.08.2019 - netarchitech added cloud feature to MACD_Value - MACD_Avg lines per HighBredCloud request

declare lower;

input fastLength = 12;
input slowLength = 26;
input MACDLength = 9;
input showBreakoutSignals = yes;
input ma_length = 21; #Length(180-200 for floating S/R , 55 for swing entry)


# Four Pole Filter
script g {
    input length = 4;
    input betaDev = 2;
    input price = OHLC4;
    def c;
    def w;
    def beta;
    def alpha;
    def G;
    c = price;
    w = (2 * Double.Pi / length);
    beta = (1 - Cos(w)) / (Power(1.414, 2.0 / betaDev) - 1 );
    alpha = (-beta + Sqrt(beta * beta + 2 * beta));
    G = Power(alpha, 4) * c +
4 * (1 – alpha) * G[1] – 6 * Power( 1 - alpha, 2 ) * G[2] +
4 * Power( 1 - alpha, 3 ) * G[3] - Power( 1 - alpha, 4 ) * G[4];
    plot Line = G;
}
# Modified MACD
plot MACD_Value = g(length = fastLength) - g(length = slowLength);
MACD_Value.Hide();
plot MACD_Avg = g(price = MACD_Value, length = MACDLength);
MACD_Avg.Hide();
addCloud(MACD_Value, MACD_Avg, Color.GREEN, Color.RED);

plot Diff = MACD_Value - MACD_Avg;
plot ZeroLine = 0;

MACD_Value.SetDefaultColor(GetColor(1));
MACD_Avg.SetDefaultColor(GetColor(8));
Diff.SetDefaultColor(GetColor(5));
Diff.SetPaintingStrategy(PaintingStrategy.HISTOGRAM);
Diff.SetLineWeight(3);
Diff.DefineColor("Positive and Up", Color.GREEN);
Diff.DefineColor("Positive and Down", Color.DARK_GREEN);
Diff.DefineColor("Negative and Down", Color.RED);
Diff.DefineColor("Negative and Up", Color.DARK_RED);
Diff.AssignValueColor(if Diff >= 0 then if Diff > Diff[1] then Diff.Color("Positive and Up") else Diff.Color("Positive and Down") else if Diff < Diff[1] then Diff.Color("Negative and Down") else Diff.Color("Negative and Up"));

ZeroLine.SetDefaultColor(GetColor(4));
ZeroLine.HideTitle();

plot UpSignal = if Diff crosses above ZeroLine then ZeroLine else Double.NaN;
plot DownSignal = if Diff crosses below ZeroLine then ZeroLine else Double.NaN;

UpSignal.SetHiding(!showBreakoutSignals);
Upsignal.SetLineWeight(3);
DownSignal.SetHiding(!showBreakoutSignals);
Downsignal.SetLineWeight(3);

UpSignal.SetDefaultColor(Color.UPTICK);
UpSignal.SetPaintingStrategy(PaintingStrategy.ARROW_UP);
UpSignal.HideTitle();
DownSignal.SetDefaultColor(Color.DOWNTICK);
DownSignal.SetPaintingStrategy(PaintingStrategy.ARROW_DOWN);
DownSignal.HideTitle();

# Forward / Reverse EMA
# (c) 2017 John F. Ehlers
# Ported to TOS 07.16.2017
# Mobius

# Inputs:
input AA = .1;

# Vars:
def CC;
def RE1;
def RE2;
def RE3;
def RE4;
def RE5;
def RE6;
def RE7;
def RE8;
def EMA;
plot EMA_Signal;
plot plot0;

CC = if CC[1] == 0 then .9 else 1 – AA;
EMA = AA * close + CC * EMA[1];
RE1 = CC * EMA + EMA[1];
RE2 = Power(CC, 2) * RE1 + RE1[1];
RE3 = Power(CC, 4) * RE2 + RE2[1];
RE4 = Power(CC, 8) * RE3 + RE3[1];
RE5 = Power(CC, 16) * RE4 + RE4[1];
RE6 = Power(CC, 32) * RE5 + RE5[1];
RE7 = Power(CC, 64) * RE6 + RE6[1];
RE8 = Power(CC, 128) * RE7 + RE7[1];

EMA_Signal = EMA – AA * RE8;
EMA_Signal.AssignValueColor(if EMA_Signal > EMA_Signal[1]
                        then Color.MAGENTA
                        else Color.CYAN);
EMA_Signal.SetLineWeight(3);

plot0 = if IsNaN(close) then Double.NaN else 0;
plot0.SetDefaultColor(Color.GRAY);
plot0.HideTitle();

#addCloud(0, Signal, color.RED, color.GREEN);

# Multi-moving average Component

#input length = 14; #hint Length: Number of periods to average the data.
input movingAverageType = {default "Simple MA", "Exponential MA", "Wilders Smoothing", "Weighted MA", "Hull MA", "Adaptive MA", "Triangular MA", "Variable MA", "Dema MA", "Tema MA", "EHMA", "THMA"};
input displace = 0;

def avg_MACD_Value = ExpAverage(2 * ExpAverage(MACD_Value, ma_length / 2) - ExpAverage(MACD_Value, ma_length), Round(Sqrt(ma_length)));
def avg_MACD_Avg = ExpAverage(2 * ExpAverage(MACD_Avg, ma_length / 2) - ExpAverage(MACD_Avg, ma_length), Round(Sqrt(ma_length)));

plot X;
X.SetDefaultColor(CreateColor(0, 102, 204));
X.SetLineWeight(3);
plot Y;
Y.SetDefaultColor(Color.WHITE);
Y.SetLineWeight(3);

switch (movingAverageType) {
case "Simple MA":
X = Average(MACD_Value, ma_length);
Y = Average(MACD_Avg, ma_length);

case "Exponential MA":
X = ExpAverage(MACD_Value, ma_length);
Y = ExpAverage(MACD_Avg, ma_length);

case "Wilders Smoothing":
X = WildersAverage(MACD_Value, ma_length);
Y = WildersAverage(MACD_Avg, ma_length);

case "Weighted MA":
X = wma(MACD_Value, ma_length);
Y = wma(MACD_Avg, ma_length);

case "Hull MA":
X = HullMovingAvg(MACD_Value, ma_length);
Y = HullMovingAvg(MACD_Avg, ma_length);

case "Adaptive MA":
X = MovAvgAdaptive(MACD_Value, ma_length);
Y = MovAvgAdaptive(MACD_Avg, ma_length);

case "Triangular MA":
X = MovAvgTriangular(MACD_Value, ma_length);
Y = MovAvgTriangular(MACD_Avg, ma_length);

case "Variable MA":
X = VariableMA(MACD_Value, ma_length);
Y = VariableMA(MACD_Avg, ma_length);

case "Dema MA":
X = DEMA(MACD_Value, ma_length);
Y = DEMA(MACD_Avg, ma_length);

case "Tema MA":
X = TEMA(MACD_Value, ma_length);
Y = TEMA(MACD_Avg, ma_length);

case EHMA:
X = ExpAverage(2 * ExpAverage(MACD_Value, ma_length / 2) - ExpAverage(MACD_Value, ma_length), Round(Sqrt(ma_length)));
Y = ExpAverage(2 * ExpAverage(MACD_Avg, ma_length / 2) - ExpAverage(MACD_Avg, ma_length), Round(Sqrt(ma_length)));

case THMA:
X = WMA(WMA(MACD_Value, (ma_length / 2) / 3) * 3 - WMA(MACD_Value, (ma_length / 2) / 2) - WMA(MACD_Value, (ma_length / 2)), (ma_length / 2));
Y = WMA(WMA(MACD_Avg, (ma_length / 2) / 3) * 3 - WMA(MACD_Avg, (ma_length / 2) / 2) - WMA(MACD_Avg, (ma_length / 2)), (ma_length / 2));
}
;# filename: MR__EZ_PercentR_MAC_
# idea source: [USER=1381]@HighBredCloud[/USER] and https://usethinkscript.com/threads/moving-average-crossover-rsi-indicator-for-thinkorswim.185/
# Code: Thanson Stevens, [USER=212]@korygill[/USER] and netarchitech
# V11.11.2019 - netarchitech added multiple-choice smoothing per HighBredCloud request
# V11.12.2019 - netarchitech modified several variables per HighBredCloud request
# V11.12.2019 - netarchitech modified several inputs per HighBredCloud request
declare lower;
# PercentR_MAC
input length = 14;
def over_Bought = 80;
def over_Sold = 20;
def lowBand = 10; #Smoothing LowerBand
def data = close;
def lower = low; #Research Lower = Low?
def highest = Highest(high, length);
def divisor = highest - Lowest(low, length);
def PI = 3.14159265359;
def a1 = Exp(-PI * Sqrt(2) / lower);
def coeff2 = 2 * a1 * Cos(Sqrt(2) * PI / lower);
def coeff3 = - Power(a1, 2);
def coeff1 = 1 - coeff2 - coeff3;
def filt = coeff1 * (data + (data[1])) / 2 + coeff2 * (filt[1]) + coeff3 * (filt[2]);
input PercentRMALength1 = 3;
input PercentRMALength2 = 5;
input PercentRMAType = AverageType.SIMPLE;
# plot and smooth PercentR
plot "%R" = if divisor equals 0 then 0 else 100 - 100 * (highest - close) / divisor;
"%R".DefineColor("OverBought", GetColor(9)); #GetColor(9));
"%R".DefineColor("Normal", GetColor(7));
"%R".DefineColor("OverSold", GetColor(1)); #GetColor(1));
"%R".AssignValueColor(if "%R" > over_Bought then "%R".Color("OverBought") else if "%R" < over_Sold then "%R".Color("OverSold") else "%R".Color("Normal"));
"%R".SetLineWeight(3);
"%R".Hide();
# plot and smooth the PercentR Moving Averages
def PercentRMA5 = MovingAverage(PercentRMAType, "%R", PercentRMALength1);
plot PercentRMovAvg5 = PercentRMA5;
PercentRMovAvg5.SetDefaultColor(Color.GREEN);
PercentRMovAvg5.SetLineWeight(3);
PercentRMovAvg5.hide();
def PercentRMA8 = MovingAverage(PercentRMAType, "%R", PercentRMALength2);
plot PercentRMovAvg8 = PercentRMA8;
PercentRMovAvg8.SetDefaultColor(Color.RED);
PercentRMovAvg8.SetLineWeight(3);
PercentRMovAvg8.hide();
input applySelectSmoothing = yes;
def smooth_it = EhlersSuperSmootherFilter(if divisor equals 0 then 0 else 100 - 100 * (highest - close) / divisor, lowBand);
def smooth_MA5 = EhlersSuperSmootherFilter(MovingAverage(PercentRMAType, "%R", PercentRMALength1));
def smooth_MA8 = EhlersSuperSmootherFilter(MovingAverage(PercentRMAType, "%R", PercentRMALength2));
input SelectSmoothingType = {default "PercentR Only", "MAs Only", "PercentR & MAs", "No Smoothing"};
plot X;
X.AssignValueColor(if "%R" > over_Bought then "%R".Color("OverBought") else if "%R" < over_Sold then "%R".Color("OverSold") else "%R".Color("Normal"));
X.SetLineWeight(3);
plot Y;
Y.SetDefaultColor(Color.GREEN);
Y.SetLineWeight(2);
plot Z;
Z.SetDefaultColor(Color.RED);
Z.SetLineWeight(2);
switch (SelectSmoothingType) {
case "PercentR Only":
X = if applySelectSmoothing and "%R" then smooth_it else "%R";
Y = if applySelectSmoothing and PercentRMA5 then PercentRMA5 else PercentRMA5;
Z = if applySelectSmoothing and PercentRMA8 then PercentRMA8 else PercentRMA8;
case "MAs Only":
X = if applySelectSmoothing and "%R" then "%R" else "%R";
Y = if applySelectSmoothing and PercentRMA5 then smooth_MA5 else PercentRMA5;
Z = if applySelectSmoothing and PercentRMA8 then smooth_MA8 else PercentRMA8;
case "PercentR & MAs":
X = if applySelectSmoothing and "%R" then smooth_it else "%R";
Y = if applySelectSmoothing and PercentRMA5 then smooth_MA5 else PercentRMA5;
Z = if applySelectSmoothing and PercentRMA8 then smooth_MA8 else PercentRMA8;
case "No Smoothing":
X = if applySelectSmoothing and"%R" then "%R" else "%R";
Y = if applySelectSmoothing and PercentRMA5 then PercentRMA5 else PercentRMA5;
Z = if applySelectSmoothing and PercentRMA8 then PercentRMA8 else PercentRMA8;
}
plot OverBought = over_Bought;
OverBought.SetDefaultColor(Color.DARK_RED);
OverBought.HideTitle();
plot OverSold = over_Sold;
OverSold.SetDefaultColor(Color.DARK_GREEN);
OverSold.HideTitle();
plot fifty_line = 50;
fifty_line.SetDefaultColor(GetColor(8));
fifty_line.HideTitle();
fifty_line.SetStyle(Curve.SHORT_DASH);
# plot the Breakout Signals
input showBreakoutSignals = no;
plot UpSignal = if "%R" crosses above OverSold then OverSold else Double.NaN;
UpSignal.SetHiding(!showBreakoutSignals);
UpSignal.SetDefaultColor(Color.UPTICK);
UpSignal.SetPaintingStrategy(PaintingStrategy.ARROW_UP);
UpSignal.SetLineWeight(3);
UpSignal.HideTitle();
plot DownSignal = if "%R" crosses below OverBought then OverBought else Double.NaN;
DownSignal.SetHiding(!showBreakoutSignals);
DownSignal.SetDefaultColor(Color.DOWNTICK);
DownSignal.SetPaintingStrategy(PaintingStrategy.ARROW_DOWN);
DownSignal.SetLineWeight(3);
DownSignal.HideTitle();
AddCloud(0, over_Sold, Color.DARK_GREEN, Color.DARK_GREEN);
AddCloud(over_Bought, 100, Color.DARK_RED, Color.DARK_RED);
# Gmode
def lengthRSI = 14;
def price = close;
def averageType = AverageType.WILDERS;
def NetChgAvg = MovingAverage(averageType, price - price[1], lengthRSI);
def TotChgAvg = MovingAverage(averageType, AbsValue(price - price[1]), lengthRSI);
def ChgRatio = if TotChgAvg != 0 then NetChgAvg / TotChgAvg else 0;
plot RSI = 50 * (ChgRatio + 1);
RSI.SetDefaultColor(CreateColor(0, 102, 204));
RSI.SetLineWeight(3);
#RSI.HideTitle();
RSI.HideBubble();
RSI.Hide();
def n1 = 9; #Channel Length
def n2 = 26; #Average Length
def n3 = 13; #Short length
def multi = no; #Multi-exchange?
def src0 = hlc3;
def src1 = hlc3(period = AggregationPeriod.MONTH);
def src2 = hlc3(period = AggregationPeriod.MONTH);
def src3 = hlc3(period = AggregationPeriod.MONTH);
def src4 = hlc3(period = AggregationPeriod.MONTH);
script tci {
input src = hlc3;
input n1 = 9; #Channel Length
input n2 = 26; #Average Length
plot tci = MovAvgExponential((src - MovAvgExponential(src, n1)) / (0.025 * MovAvgExponential(AbsValue(src - MovAvgExponential(src, n1)), n1)), n2) + 50;
tci.Hide();
}
#mf(src) => rsi(sum(volume * (change(src) <= 0 ? 0 : src), n3), sum(volume * (change(src) >= 0 ? 0 : src), n3))
script mf {
input src = hlc3;
input n3 = 13; #Short length
def rsi = reference RSI();
#plot mf = rsi(Sum(volume * (if Average(src) <= 0 then 0 else src), n3), Sum(volume * (if Average(src) >= 0 then 0 else src), n3));
plot mf = RSI(n3, src);
mf.Hide();
}
script willy {
input src = hlc3;
input n2 = 26; #Average Length
plot willy = 60 * (src - Highest(src, n2)) / (Highest(src, n2) - Lowest(src, n2)) + 80;
willy.Hide();
}
#csi(src) => avg(rsi(src, n3),tsi(src0,n1,n2)*50+50)
script csi {
input src = hlc3;
input n1 = 9; #Channel Length
input n2 = 26; #Average Length
input n3 = 13; #Short length
def rsi = reference RSI();
plot csi = RSI(n3, src) + TrueStrengthIndex(n1, n2) / 2 * 50 + 50;
csi.Hide();
}
script godmode {
input src = hlc3;
def rsi = reference RSI();
plot godmode = (tci(src) + CSI(src) + mf(src) + willy(src)) / 4;
godmode.Hide();
}
script tradition {
input src = hlc3;
input n3 = 13; #Short length
def rsi = reference RSI();
plot tradition = (tci(src) + mf(src) + RSI(n3, src)) / 3;
tradition.Hide();
}
def wt1 = if multi then (godmode(src0) + godmode(src1) + godmode(src2) + godmode(src3) + godmode(src4) / 5) else tradition(src0);
def wt2 = SimpleMovingAvg(wt1, 6);
def extended = if wt2 < 20 then wt2 + 5 else if wt2 > 80 then wt2 - 5 else Double.NaN;
plot wta = wt1;
wta.SetDefaultColor(Color.GREEN);
wta.SetLineWeight(2);
wta.Hide();
plot wtb = wt2;
wtb.SetDefaultColor(Color.RED);
wtb.SetLineWeight(2);
wtb.Hide();
plot ext = extended; #Caution!
ext.SetPaintingStrategy(PaintingStrategy.POINTS);
ext.SetDefaultColor(Color.YELLOW);
ext.SetLineWeight(3);#STSW = Schaff Trend Line and Schaff Wave Line
#Schaff Trend Line = Used for quick up/down trend declaration
#Schaff Wave Line = Trade Wave in the direction of trend as
#declared by Trend Line.
#Schaff Wave Line can be used alone to enter trend
#declared by the MACD.
#Schaff Wave can be used with the EMA for signals
declare lower;
input fastLengthTrend = 48;
input slowLengthTrend = 104;
input KPeriodTrend = 36;
input DPeriodTrend = 8;
input averageTypeTrend = AverageType.EXPONENTIAL;
input fastLengthWave = 12;
input slowLengthWave = 26;
input KPeriodWave = 9;
input DPeriodWave = 2;
input over_bought = 75;
input over_sold = 25;
input averageTypeWave = AverageType.EXPONENTIAL;
def macdTrend = MovingAverage(averageTypeTrend, close, fastLengthTrend) - MovingAverage(averageTypeTrend, close, slowLengthTrend);
def macdWave = MovingAverage(averageTypeWave, close, fastLengthWave) - MovingAverage(averageTypeWave, close, slowLengthWave);
def fastK1Trend = FastKCustom(macdTrend, KPeriodTrend);
def fastK1Wave = FastKCustom(macdWave, KPeriodWave);
def fastD1Trend = MovingAverage(averageTypeTrend, fastK1Trend, DPeriodTrend);
def fastD1Wave = MovingAverage(averageTypeWave, fastK1Wave, DPeriodWave);
def fastK2Trend = FastKCustom(fastD1Trend, KPeriodTrend);
def fastK2Wave = FastKCustom(fastD1Wave, KPeriodWave);
plot STCTrend = MovingAverage(averageTypeTrend, fastK2Trend, DPeriodTrend);
plot STCWave = MovingAverage(averageTypeWave, fastK2Wave, DPeriodWave);
plot OverBought = over_bought;
plot OverSold = over_sold;
STCTrend.SetDefaultColor(GetColor(8));
STCWave.SetDefaultColor(GetColor(8));
OverBought.SetDefaultColor(GetColor(7));
OverSold.SetDefaultColor(GetColor(7));
STCTrend.DefineColor("Up", GetColor(1));
STCTrend.DefineColor("Down", GetColor(0));
STCTrend.AssignValueColor(if STCTrend > STCTrend[1] then STCTrend.Color("Up") else STCTrend.Color("Down"));
STCWave.DefineColor("Up", GetColor(1));
STCWave.DefineColor("Down", GetColor(0));
STCWave.AssignValueColor(if STCWave > STCWave[1] then STCWave.Color("Up") else STCWave.Color("Down"));
input lengthWave = 10;
plot AvgExpWave = ExpAverage(STCWave, lengthWave);
AvgExpWave.SetDefaultColor(GetColor(1));| Thread starter | Similar threads | Forum | Replies | Date |
|---|---|---|---|---|
|
|
Nirvana Holy Grail Inside Bar Outside Bar For ThinkOrSwim | Indicators | 10 | |
| G | TradingWarz Holy Grail / Nirvana For ThinkOrSwim | Indicators | 17 | |
|
|
Holy Grail ADX Trading Setup for ThinkorSwim | Indicators | 61 |
Start a new thread and receive assistance from our community.
useThinkScript is the #1 community of stock market investors using indicators and other tools to power their trading strategies. Traders of all skill levels use our forums to learn about scripting and indicators, help each other, and discover new ways to gain an edge in the markets.
We get it. Our forum can be intimidating, if not overwhelming. With thousands of topics, tens of thousands of posts, our community has created an incredibly deep knowledge base for stock traders. No one can ever exhaust every resource provided on our site.
If you are new, or just looking for guidance, here are some helpful links to get you started.