The Rate Of Change (ROC) is an oscillator calculating the percentage change of the security price relative to the price of a specified number (length) of periods before. The higher/lower the ROC, the more overbought/oversold the security; when the ROC falls, a rally might occur.
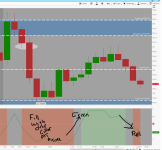
When I am in a price action trade or scalping I tend to watch the Time and Sales or Level2 price to get the most entry/exit of the position. That took too much brain energy to watch like I am in a Twilight Zone. So, I've come up with a simple ROC lower indicator to help me see the average of the last period prices if the price is increasing/decreasing and direction. This beats watching the Time and Sales or Level2. It works well on trending and momentum with price action securities. It works for me and would like to share it with you all. Let me know if ROC works and helps you too.

To use the Price Rate of Change (ROC) indicator in day trading, primarily focus on identifying potential entry points by observing when the ROC crosses the zero line, with positive values signaling bullish momentum and negative values indicating bearish momentum; look for divergences between price action and the ROC to spot potential trend reversals, and use the indicator's magnitude to gauge the strength of the current price movement, with larger positive/negative values signifying stronger trends; remember to consider other technical indicators and price action analysis alongside the ROC for confirmation.
Key points to remember when using the ROC in day trading:
When I am in a price action trade or scalping I tend to watch the Time and Sales or Level2 price to get the most entry/exit of the position. That took too much brain energy to watch like I am in a Twilight Zone. So, I've come up with a simple ROC lower indicator to help me see the average of the last period prices if the price is increasing/decreasing and direction. This beats watching the Time and Sales or Level2. It works well on trending and momentum with price action securities. It works for me and would like to share it with you all. Let me know if ROC works and helps you too.
To use the Price Rate of Change (ROC) indicator in day trading, primarily focus on identifying potential entry points by observing when the ROC crosses the zero line, with positive values signaling bullish momentum and negative values indicating bearish momentum; look for divergences between price action and the ROC to spot potential trend reversals, and use the indicator's magnitude to gauge the strength of the current price movement, with larger positive/negative values signifying stronger trends; remember to consider other technical indicators and price action analysis alongside the ROC for confirmation.
Key points to remember when using the ROC in day trading:
- Interpreting the Zero Line:
- Positive ROC (above zero): Indicates an uptrend with bullish momentum.
- Negative ROC (below zero): Indicates a downtrend with bearish momentum.
- Crossovers: When the ROC crosses from negative to positive, it can signal a potential bullish entry; conversely, a crossover from positive to negative might suggest a bearish entry.
- Positive ROC (above zero): Indicates an uptrend with bullish momentum.
- Identifying Divergence:
- Bullish Divergence: When price makes a lower low while the ROC shows a higher low, it can signal a potential trend reversal to the upside.
- Bearish Divergence: When price makes a higher high while the ROC shows a lower high, it could indicate a potential trend reversal to the downside.
- Bullish Divergence: When price makes a lower low while the ROC shows a higher low, it can signal a potential trend reversal to the upside.
- Strength of Momentum:
- Large Positive ROC Values: Indicate strong upward price movement.
- Large Negative ROC Values: Indicate strong downward price movement.
- Large Positive ROC Values: Indicate strong upward price movement.
- Select a suitable time period:
For day trading, typically use a shorter period like 10 or 14 to capture faster price fluctuations.
- Look for confirmation:
Don't solely rely on the ROC; combine it with other technical indicators and price action analysis to confirm potential trade signals.
- Adjust based on volatility:
In highly volatile markets, the ROC may generate more false signals, so consider adjusting the time period or using other indicators to filter out noise.
Ruby:
# Rate of Change
# cabe1332
#The Rate Of Change (ROC) is an oscillator calculating the percentage change of the security price relative to the price a specified number (length) of periods before. The higher the ROC, the more overbought the security; when the ROC falls, a rally might occur.

# 10/20/2021 Rev.1
# TOC ROC with labels

# 10/23/2021 Rev.2
# added support and condition for bulls and bears labels
# added RSI and EMA stacked for better entry/exit labels
# added support for Profit Taking conditions with labels


## code start

declare lower;

input length = 7;
input colorNormLength = 7;
input price = close;
input bullthreshold = 2;
input bearthreshold = -2;

Assert(length > 0, "'length' must be positive: " + length);

plot ROC = if price[length] != 0 then (price / price[length] - 1) * 100 else 0;
ROC.DefineColor("Highest", Color.GREEN);
ROC.DefineColor("Lowest", Color.RED);
ROC.AssignNormGradientColor(colorNormLength, ROC.Color("Lowest"), ROC.Color("Highest"));
ROC.SetLineWeight(2);

plot zeroline = if !IsNaN(close) then 0 else Double.NaN;
zeroline.AssignValueColor(if ROC > 0 then Color.GREEN else Color.LIGHT_RED);
zeroline.SetPaintingStrategy(PaintingStrategy.dashES);
zeroline.SetLineWeight(1);

# RSI
def rsi = RSI()."RSI" is greater than or equal to 30 and RSI()."RSI" is less than or equal to 70 within 2 bar;

#EMAstacked#
def BULLISHstackedUp = MovAvgExponential("length" = 8)."AvgExp" is greater than MovAvgExponential("length" = 21)."AvgExp"
and MovAvgExponential("length" = 21)."AvgExp" is greater than MovAvgExponential("length" = 34)."AvgExp"
and MovAvgExponential("length" = 34)."AvgExp" is greater than MovAvgExponential("length" = 50)."AvgExp" within 2 bars;

def BEARstackedUp = MovAvgExponential("length" = 8)."AvgExp" is less than MovAvgExponential("length" = 21)."AvgExp"
and MovAvgExponential("length" = 21)."AvgExp" is less than MovAvgExponential("length" = 34)."AvgExp"
and MovAvgExponential("length" = 34)."AvgExp" is less than MovAvgExponential("length" = 50)."AvgExp" within 2 bars;

# ROC increasing or decreasing label
AddLabel(yes, if ROC > ROC[1] then " ROC Increasing " + Round(ROC, 2) + " " else " ROC Decreasing " + Round(ROC, 2) + " ", if ROC > ROC[1] then Color.GREEN else Color.RED);

# BULLISH OR BULLISH OR NEUTRAL
AddLabel(yes, if ROC >= bullthreshold then " BULLISH " else if ROC <= bearthreshold then " BEARISH " else " Wait & Watch ", if ROC >= bullthreshold then Color.GREEN else if ROC <= bearthreshold then Color.RED else Color.WHITE);

# GOING LONG OR SHORT BUY
def LONGBUY = ROC >= bullthreshold and rsi and BULLISHstackedUp;
def SHORTBUY = ROC <= bearthreshold and rsi and BEARstackedUp;
AddLabel(yes, if LONGBUY then " BUY LONG " else if SHORTBUY then " Sell SHORT " else "", if LONGBUY then Color.GREEN else if SHORTBUY then Color.RED else Color.WHITE);

# PERSONAL MESSAGE TO TAKE PROFITS
def TakeProfit = (ROC between 10 and 20) or (ROC between -10 and -20);
def SeriouslyTakeProfit = (ROC between 21 and 50) or (ROC between -21 and -50);
def FinTakeProfit = (ROC between 51 and 99) or (ROC between -51 and -99);
def DontBeLoser = (ROC >= 100) or (ROC <= -100);
AddLabel(yes, if TakeProfit then " Take Profit! " else if SeriouslyTakeProfit then " SERIOUSLY, Take Profit! " else if FinTakeProfit then " ****IN! Take Profit! " else if DontBeLoser then " DON'T BE A LOSER! Take Profit! " else "", if TakeProfit then Color.GREEN else if SeriouslyTakeProfit then Color.CYAN else if FinTakeProfit then Color.ORANGE else if DontBeLoser then Color.MAGENTA else Color.BLACK);

DefineGlobalColor("Bullish", Color.cyan);
DefineGlobalColor("Bearish", Color.pink);
AddCloud(ROC, zeroline , globalColor("Bullish"), globalColor("Bearish"));
## end code
Last edited by a moderator: