Hello!
I've tried searching but could not find any thread on the matter. If I am at fault here, please, share a link. For that I thank you in advance. If there is no such thread, here is what I am trying to do. It is like the "PrevoiuseDayClose" indicator, but I need it to show the VWAP value at close (16:00) and have a flat line plotted for current day.
Like the one in the link below. https://www.tradingview.com/script/TczzZxF6-Current-and-Previous-day-VWAP/
Any help would be appreciated!
Thank you all and wish you a Very Merry Christmas!
Thank you very much!
That is more than I asked for. Now I can get rid of my PreviousDayClose & PreviousDayHighLow indicators and have all of those combined in one indicator!.
Thank you!
I've tried various pieces of code to define the last VWAP value for the previous day including using a specific time, and the code that SleepyZ most graciously shared here.
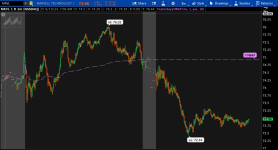
I've included a screenshot of the various lines that plot and the dotted line that I'm looking for.
I'm also including all the code I've used so far.
I'm also trying to get the bubble to appear on the left side but for some reason just won't appear, if anyone knows the answer to that one. thanks.
Ruby:
declare once_per_bar;
input DisplayTime = {default Day, Everyday};
input lookback = 1;
def bar = BarNumber();
def nan = Double.NaN;
def yyyyMmDd = GetYYYYMMDD();
def ShowChartBubbles = yes;
def targetTime = SecondsFromTime(1615) == 0;

#Defines each Day's Bars with zero for current day and +1 for each subsequent day
def ymd = GetYYYYMMDD();
def candles = !IsNaN(close);
def capture = candles and ymd != ymd[1];
def dayCount = CompoundValue(1, if capture then dayCount[1] + 1 else dayCount[1], 0);
def thisDay = (HighestAll(dayCount) - dayCount);


# Calculate the previous day's VWAP including post-market
def isNewDay = GetDay() != GetDay()[1];

def prevDayVWAP1 = if isNewDay[1] then vwap[1] else prevDayVWAP1[1];

def prevDayVWAP2 = if isNewDay[1] and !isNewDay then vwap[1] else prevDayVWAP2[1];

def prevDayVWAP3 = if isNewDay and !isNewDay[1] then vwap[1] else CompoundValue(1, prevDayVWAP3[1], vwap);

def prevDayVWAP4 = if targetTime[1] then vwap[1] else prevDayVWAP4[1];

def startTime = 0930;
#-- define select plot periods
def today = if (GetDay() == GetLastDay()) and (SecondsFromTime(startTime) >= 0) then 1 else 0;

def LinePeriod;

switch (DisplayTime){
case Day:
LinePeriod = today;
case Everyday:
LinePeriod = startTime;
}

# Plot the previous day's VWAP as a dashed line
plot prevDayVWAPLine1 = if LinePeriod != 0 then prevDayVWAP1 else nan;
prevDayVWAPLine1.SetDefaultColor(GetColor(0));
prevDayVWAPLine1.SetLineWeight(4);
prevDayVWAPLine1.SetStyle(Curve.FIRM);

plot prevDayVWAPLine2 = if LinePeriod != 0 then prevDayVWAP2 else nan;
prevDayVWAPLine2.SetDefaultColor(GetColor(0));
prevDayVWAPLine2.SetLineWeight(4);
prevDayVWAPLine2.SetStyle(Curve.FIRM);

plot prevDayVWAPLine3 = if LinePeriod != 0 then prevDayVWAP3 else nan;
prevDayVWAPLine3.SetDefaultColor(GetColor(0));
prevDayVWAPLine3.SetLineWeight(4);
prevDayVWAPLine3.SetStyle(Curve.FIRM);

plot prevDayVWAPLine4 = if LinePeriod != 0 then prevDayVWAP4 else nan;
prevDayVWAPLine4.SetDefaultColor(GetColor(0));
prevDayVWAPLine4.SetLineWeight(4);
prevDayVWAPLine4.SetStyle(Curve.FIRM);

def closeday = if thisDay == lookback and GetTime() <= RegularTradingEnd(GetYYYYMMDD()) then vwap else closeday[1];


plot prevDayVWAPLine5 = if LinePeriod != 0 then closeday else nan;
prevDayVWAPLine5.SetDefaultColor(GetColor(0));
prevDayVWAPLine5.SetLineWeight(4);
prevDayVWAPLine5.SetStyle(Curve.FIRM);

#AddChartBubble(ShowChartBubbles and bar == prevDayVWAP,
# prevDayVWAPLine,
# "2day VWAP",
# Color.BLUE,
# 1);
I've tried various pieces of code to define the last VWAP value for the previous day including using a specific time, and the code that SleepyZ most graciously shared here.
I've included a screenshot of the various lines that plot and the dotted line that I'm looking for.
I'm also including all the code I've used so far.
I'm also trying to get the bubble to appear on the left side but for some reason just won't appear, if anyone knows the answer to that one. thanks.
Ruby:
declare once_per_bar;
input DisplayTime = {default Day, Everyday};
input lookback = 1;
def bar = BarNumber();
def nan = Double.NaN;
def yyyyMmDd = GetYYYYMMDD();
def ShowChartBubbles = yes;
def targetTime = SecondsFromTime(1615) == 0;

#Defines each Day's Bars with zero for current day and +1 for each subsequent day
def ymd = GetYYYYMMDD();
def candles = !IsNaN(close);
def capture = candles and ymd != ymd[1];
def dayCount = CompoundValue(1, if capture then dayCount[1] + 1 else dayCount[1], 0);
def thisDay = (HighestAll(dayCount) - dayCount);


# Calculate the previous day's VWAP including post-market
def isNewDay = GetDay() != GetDay()[1];

def prevDayVWAP1 = if isNewDay[1] then vwap[1] else prevDayVWAP1[1];

def prevDayVWAP2 = if isNewDay[1] and !isNewDay then vwap[1] else prevDayVWAP2[1];

def prevDayVWAP3 = if isNewDay and !isNewDay[1] then vwap[1] else CompoundValue(1, prevDayVWAP3[1], vwap);

def prevDayVWAP4 = if targetTime[1] then vwap[1] else prevDayVWAP4[1];

def startTime = 0930;
#-- define select plot periods
def today = if (GetDay() == GetLastDay()) and (SecondsFromTime(startTime) >= 0) then 1 else 0;

def LinePeriod;

switch (DisplayTime){
case Day:
LinePeriod = today;
case Everyday:
LinePeriod = startTime;
}

# Plot the previous day's VWAP as a dashed line
plot prevDayVWAPLine1 = if LinePeriod != 0 then prevDayVWAP1 else nan;
prevDayVWAPLine1.SetDefaultColor(GetColor(0));
prevDayVWAPLine1.SetLineWeight(4);
prevDayVWAPLine1.SetStyle(Curve.FIRM);

plot prevDayVWAPLine2 = if LinePeriod != 0 then prevDayVWAP2 else nan;
prevDayVWAPLine2.SetDefaultColor(GetColor(0));
prevDayVWAPLine2.SetLineWeight(4);
prevDayVWAPLine2.SetStyle(Curve.FIRM);

plot prevDayVWAPLine3 = if LinePeriod != 0 then prevDayVWAP3 else nan;
prevDayVWAPLine3.SetDefaultColor(GetColor(0));
prevDayVWAPLine3.SetLineWeight(4);
prevDayVWAPLine3.SetStyle(Curve.FIRM);

plot prevDayVWAPLine4 = if LinePeriod != 0 then prevDayVWAP4 else nan;
prevDayVWAPLine4.SetDefaultColor(GetColor(0));
prevDayVWAPLine4.SetLineWeight(4);
prevDayVWAPLine4.SetStyle(Curve.FIRM);

def closeday = if thisDay == lookback and GetTime() <= RegularTradingEnd(GetYYYYMMDD()) then vwap else closeday[1];


plot prevDayVWAPLine5 = if LinePeriod != 0 then closeday else nan;
prevDayVWAPLine5.SetDefaultColor(GetColor(0));
prevDayVWAPLine5.SetLineWeight(4);
prevDayVWAPLine5.SetStyle(Curve.FIRM);

#AddChartBubble(ShowChartBubbles and bar == prevDayVWAP,
# prevDayVWAPLine,
# "2day VWAP",
# Color.BLUE,
# 1);
So you want yesterday's VWAP, at close of regular trading, as a line across today's chart??
I found this a while ago (sorry I am unable to attribute it to the rightful genius). It should do what you need.
Note: Bubble appears at right hand edge, I labeled it "YVWAP" (= Yesterday's VWAP). Rename as you like.
Also, I have bubblemover value at "5" and Expansion area at 20 (Chart Settings > Time axis > Expansion area = 20). Both can be adjusted to have the bubble appear where you prefer. Time zoom affects this positioning, so play around with both values.
I hope this helps.
#Previous Lookback Day's Close extended to right edge with option to limit it to show only current day (thisday == 0)
input showtodayonly = no;
input lookback = 1;
#Defines each Day's Bars with zero for current day and +1 for each subsequent day
def ymd = GetYYYYMMDD();
def candles = !IsNaN(close);
def capture = candles and ymd != ymd[1];
def dayCount = CompoundValue(1, if capture then dayCount[1] + 1 else dayCount[1], 0);
def thisDay = (HighestAll(dayCount) - dayCount);
#Lookback Day's Low plotted to the right edge unless showtodayonly selected, limiting that plot to current day
def vwapday = if thisDay == lookback and
GetTime() <= RegularTradingEnd(GetYYYYMMDD())
then reference vwap
else vwapday[1];
plot datavwap = if showtodayonly and thisDay > 0
then Double.NaN
else vwapday;
datavwap.SetPaintingStrategy(PaintingStrategy.HORIZONTAL);
datavwap.SetDefaultColor(Color.cyan);
I've tried various pieces of code to define the last VWAP value for the previous day including using a specific time, and the code that SleepyZ most graciously shared here.
I've included a screenshot of the various lines that plot and the dotted line that I'm looking for.
I'm also including all the code I've used so far.
I'm also trying to get the bubble to appear on the left side but for some reason just won't appear, if anyone knows the answer to that one. thanks.
Ruby:
declare once_per_bar;
input DisplayTime = {default Day, Everyday};
input lookback = 1;
def bar = BarNumber();
def nan = Double.NaN;
def yyyyMmDd = GetYYYYMMDD();
def ShowChartBubbles = yes;
def targetTime = SecondsFromTime(1615) == 0;

#Defines each Day's Bars with zero for current day and +1 for each subsequent day
def ymd = GetYYYYMMDD();
def candles = !IsNaN(close);
def capture = candles and ymd != ymd[1];
def dayCount = CompoundValue(1, if capture then dayCount[1] + 1 else dayCount[1], 0);
def thisDay = (HighestAll(dayCount) - dayCount);


# Calculate the previous day's VWAP including post-market
def isNewDay = GetDay() != GetDay()[1];

def prevDayVWAP1 = if isNewDay[1] then vwap[1] else prevDayVWAP1[1];

def prevDayVWAP2 = if isNewDay[1] and !isNewDay then vwap[1] else prevDayVWAP2[1];

def prevDayVWAP3 = if isNewDay and !isNewDay[1] then vwap[1] else CompoundValue(1, prevDayVWAP3[1], vwap);

def prevDayVWAP4 = if targetTime[1] then vwap[1] else prevDayVWAP4[1];

def startTime = 0930;
#-- define select plot periods
def today = if (GetDay() == GetLastDay()) and (SecondsFromTime(startTime) >= 0) then 1 else 0;

def LinePeriod;

switch (DisplayTime){
case Day:
LinePeriod = today;
case Everyday:
LinePeriod = startTime;
}

# Plot the previous day's VWAP as a dashed line
plot prevDayVWAPLine1 = if LinePeriod != 0 then prevDayVWAP1 else nan;
prevDayVWAPLine1.SetDefaultColor(GetColor(0));
prevDayVWAPLine1.SetLineWeight(4);
prevDayVWAPLine1.SetStyle(Curve.FIRM);

plot prevDayVWAPLine2 = if LinePeriod != 0 then prevDayVWAP2 else nan;
prevDayVWAPLine2.SetDefaultColor(GetColor(0));
prevDayVWAPLine2.SetLineWeight(4);
prevDayVWAPLine2.SetStyle(Curve.FIRM);

plot prevDayVWAPLine3 = if LinePeriod != 0 then prevDayVWAP3 else nan;
prevDayVWAPLine3.SetDefaultColor(GetColor(0));
prevDayVWAPLine3.SetLineWeight(4);
prevDayVWAPLine3.SetStyle(Curve.FIRM);

plot prevDayVWAPLine4 = if LinePeriod != 0 then prevDayVWAP4 else nan;
prevDayVWAPLine4.SetDefaultColor(GetColor(0));
prevDayVWAPLine4.SetLineWeight(4);
prevDayVWAPLine4.SetStyle(Curve.FIRM);

def closeday = if thisDay == lookback and GetTime() <= RegularTradingEnd(GetYYYYMMDD()) then vwap else closeday[1];


plot prevDayVWAPLine5 = if LinePeriod != 0 then closeday else nan;
prevDayVWAPLine5.SetDefaultColor(GetColor(0));
prevDayVWAPLine5.SetLineWeight(4);
prevDayVWAPLine5.SetStyle(Curve.FIRM);

#AddChartBubble(ShowChartBubbles and bar == prevDayVWAP,
# prevDayVWAPLine,
# "2day VWAP",
# Color.BLUE,
# 1);
This modification of the code above gives you the option to plot the Previous Day's close of the VWAP either on the left side as shown on your image or the right expansion.
#Previous Days Lookback VWAP extended to right edge with option to show_bubble on right or left side

input lookback = 1;

#Defines each Day's Bars with zero for current day and +1 for each subsequent day
def ymd      = GetYYYYMMDD();
def candles  = !IsNaN(close);
def capture  = candles and ymd != ymd[1];
def dayCount = CompoundValue(1, if capture then dayCount[1] + 1 else dayCount[1], 0);
def thisDay  = (HighestAll(dayCount) - dayCount);

#Lookback Day's Close defined and extended to right edge
def closeday   = if thisDay == lookback and
                    GetTime() <= RegularTradingEnd(GetYYYYMMDD())
                 then close
                 else closeday[1];


#Lookback Day's Low plotted to the right edge unless showtodayonly selected, limiting that plot to current day
def vwapday     = if thisDay == lookback and
                    GetTime() <= RegularTradingEnd(GetYYYYMMDD())
                 then reference VWAP
                 else vwapday[1];
plot datavwap   = vwapday;
datavwap.SetPaintingStrategy(PaintingStrategy.HORIZONTAL);
datavwap.SetDefaultColor(Color.CYAN);

#Bubbles
input showbubbles = yes;
input bubblemover = 0;
input show_bubble = {default right, left};
input show_price  = yes;
def bm  = bubblemover;
def bm1 = bm + 1;
def right = IsNaN(close[bm]) and !IsNaN(close[bm1]);
def left  = thisDay[1] == lookback  and thisday == lookback - 1  ;

AddChartBubble(showbubbles and if show_bubble==show_bubble.right then right else left, datavwap[bm], "VWAP" + lookback +  (if show_price then " - "+asdollars(datavwap[bm]) else ""), datavwap.TakeValueColor());

#
useThinkScript is the #1 community of stock market investors using indicators and other tools to power their trading strategies. Traders of all skill levels use our forums to learn about scripting and indicators, help each other, and discover new ways to gain an edge in the markets.
How do I get started?
We get it. Our forum can be intimidating, if not overwhelming. With thousands of topics, tens of thousands of posts, our community has created an incredibly deep knowledge base for stock traders. No one can ever exhaust every resource provided on our site.
If you are new, or just looking for guidance, here are some helpful links to get you started.
VIP members get exclusive access to these proven and tested premium indicators: Buy the Dip, Advanced Market Moves 2.0, Take Profit, and Volatility Trading Range. In addition, VIP members get access to over 50 VIP-only custom indicators, add-ons, and strategies, private VIP-only forums, private Discord channel to discuss trades and strategies in real-time, customer support, trade alerts, and much more. Learn all about VIP membership here.
How can I access the premium indicators?
To access the premium indicators, which are plug and play ready, sign up for VIP membership here.