Hello lovely people,
I am looking for some help with a think or swim script.
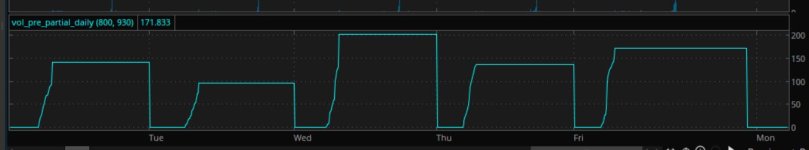
My goal is to display premarket volume as a sum total, only between 8:00-9:29 AM EST (i.e. premarket, but not including 4 am-8 am), for stocks in my watchlist (aapl, googl, bidu, for example). I do not need this displayed on any chart for now, just as a custom column in the watchlist.
I'm using this code below, but the values displayed end in E7, E8, E9, or E10 i.e. big numbers. Is it because TOS is showing shadow volume not normally displayed? I read that on another thread for a different topic, so maybe it's a real thing.
--
input startTime = 0800;
input endTime = 0929;
def startCounter = SecondsFromTime(startTime);
def endCounter = SecondsTillTime(endTime);
def targetPeriod = if startCounter >= 0 and endCounter >= 0 then 1 else 0;
# This is the cumulative volume for the current day
def totalVolume = if targetPeriod and !targetPeriod[1] then volume
else if targetPeriod then totalVolume[1] + volume
else totalVolume[1];
plot signal = totalVolume;
--
Also, the volume keeps updating. It's now past 9:30 AM EST when I check, so I know I'm not seeing exactly what I want since volume should stop updating after 9:29 AM. Is this a limitation of TOS software, that volume can't be summed only for a specific timeframe? Or, volume calculations constantly update and can't be "time locked" (stop calculating after a specific time of day)?
If what I'm looking for is not available in TOS, any other ideas how I can get at this information quickly? Premarket volume between specific hours. An example of the output I'm looking for:
Ticker
Sum of volume (8 - 9:29 AM EST) for current day
aapl
45,323
bidu
223,322
Thank you in advance for your help.
Tristan
I am looking for some help with a think or swim script.
My goal is to display premarket volume as a sum total, only between 8:00-9:29 AM EST (i.e. premarket, but not including 4 am-8 am), for stocks in my watchlist (aapl, googl, bidu, for example). I do not need this displayed on any chart for now, just as a custom column in the watchlist.
I'm using this code below, but the values displayed end in E7, E8, E9, or E10 i.e. big numbers. Is it because TOS is showing shadow volume not normally displayed? I read that on another thread for a different topic, so maybe it's a real thing.
--
input startTime = 0800;
input endTime = 0929;
def startCounter = SecondsFromTime(startTime);
def endCounter = SecondsTillTime(endTime);
def targetPeriod = if startCounter >= 0 and endCounter >= 0 then 1 else 0;
# This is the cumulative volume for the current day
def totalVolume = if targetPeriod and !targetPeriod[1] then volume
else if targetPeriod then totalVolume[1] + volume
else totalVolume[1];
plot signal = totalVolume;
--
Also, the volume keeps updating. It's now past 9:30 AM EST when I check, so I know I'm not seeing exactly what I want since volume should stop updating after 9:29 AM. Is this a limitation of TOS software, that volume can't be summed only for a specific timeframe? Or, volume calculations constantly update and can't be "time locked" (stop calculating after a specific time of day)?
If what I'm looking for is not available in TOS, any other ideas how I can get at this information quickly? Premarket volume between specific hours. An example of the output I'm looking for:
Ticker
Sum of volume (8 - 9:29 AM EST) for current day
aapl
45,323
bidu
223,322
Thank you in advance for your help.
Tristan