Author Message:
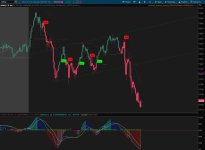
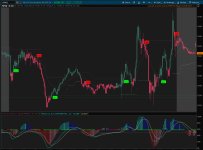
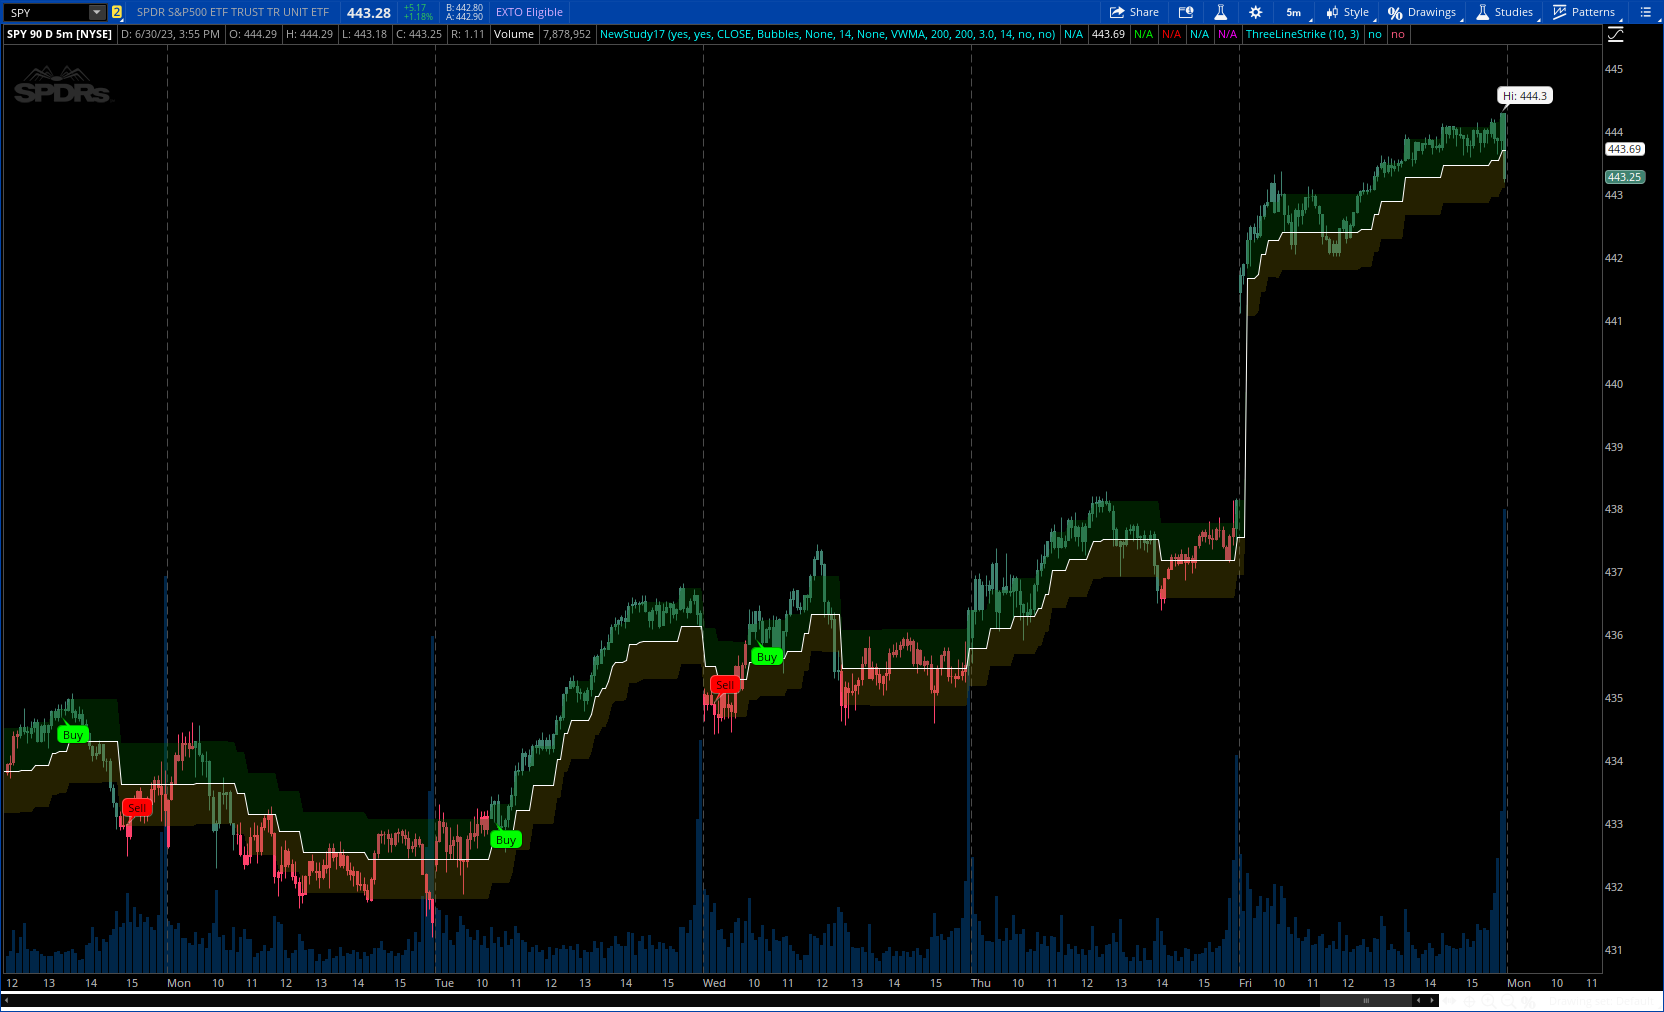
The Powertrend is a range filter that is based off of volume, instead of price. This helps the range filter capture trends more accurately than a price-based range filter, because the range filter will update itself from changes in volume instead of changes in price. In certain scenarios this means that the Powertrend will be more profitable than a normal range filter.
Essentials of the Strategy
This is a breakout strategy which works best on trending assets with high volume and liquidity. It should be used on middle to higher timeframes and can be used on all assets that have volume provided by the data source (stocks, crypto, forex). It is long-only as of now. It can work on lower timeframes if you optimize the strategy filters to make less trades or if your exchange/broker is low/no fees, provided that your exchange/broker has high liquidity and volume.
The strategy enters a long position if the range filter is trending upwards and the price crosses over the upper range band, which signifies a price-volume breakout. The strategy closes the long position if the range filter is trending downwards and the price crosses under the lower range band, which signifies a breakdown. Both these conditions can be altered by the three filter options in the settings. The default trend filter is not alterable because it helps prevent false entries and exits that are against the trend.
more details : https://www.tradingview.com/v/45FlB2qH/
CODE:
CSS:
#// This source code is subject to the terms of the Mozilla Public License 2.0 at https://mozilla.org/MPL/2.0/
#https://www.tradingview.com/v/45FlB2qH/
#// © wbburgin
#strategy("Powertrend - Volume Range Filter [wbburgin]",
#converted by Sam4Cok@samer800    - 07/2023
#rngfilt_volumeadj(float source1, float tethersource, float smoothrng)=>
script rngfilt_volumeadj {
    input source1 = close;
    input tethersource = volume;
    input smoothrng = 3;
    def srcNeg = (source1 - smoothrng);
    def srcPos = (source1 + smoothrng);
    def rngfilt;
    if rngfilt[1] == 0 {
        rngfilt = source1;
    } else
    if tethersource > tethersource[1] {
        rngfilt = if srcNeg < rngfilt[1] then rngfilt[1] else srcNeg;
    } else {
        rngfilt = if srcPos > rngfilt[1] then rngfilt[1] else srcPos;
    }
    plot out = rngfilt;
}
#/ Average Range SMOOTHING
#export smoothrng(float source, int sampling_period = 50, float range_mult = 3)=>
script smoothrng {
    input source = close;
    input sampling_period = 50;
    input range_mult = 3;
    def wper = (sampling_period * 2) - 1;
    def diff = AbsValue(source - source[1]);
    def avrng     = ExpAverage(diff, sampling_period);
    def smoothrng = ExpAverage(avrng, wper) * range_mult;
    plot out = smoothrng;
}
#export trendUp(float source)=>
script trendUp {
    input source = close;
    def upward = CompoundValue(1,
                 if source > source[1] then upward[1] + 1 else
                 if source < source[1] then 0 else upward[1], 0);
    plot out = upward;
}
input barColors = yes;        # "Bar Colors"
input highlighting = yes;     # "Highlighting"
input src = close;
input SignalStyle = { Default Bubbles, Arrows, "Don't Show"};
input FilterSignals = {"Volatility", "Volume", "ADX", "Regime", "All", default "None"};# 'Filter Signals by'
input FiltersLength = 14;
input useFilters   = {"Moving Average", Supertrend, "Moving Avg & Supertrend" , default None};
input MovAvgType  = {SMA, EMA, SMMA, VAWMA,default VWMA, RMS, McGinley, Gaussian, TRAEM, MAV};
input MovAvgLength = 200;
input rangeFilterLength = 200;
input rangeMulti    = 3.0;
input RangeSupertrendLength = 14;
input showSupertrend = no;
input showMovingAvgLine = no;

#// ] -------------- FUNCTIONS : Moving Avg ------------------ [
#vwma(source, length)
script vwma {
   input src = close;
   input len = 15;
    def v = if isNaN(volume) then volume[1] else volume;
    def VWMA = SimpleMovingAvg(src * v, len) / SimpleMovingAvg(v, len);
    plot out = VWMA;
}
#rms(source, length)=>
script rms {
    input source = close;
    input length = 14;
    def rms = Sqrt(Sum(Power(source, 2), length) / length);
    plot return = rms;
}
#mav (source, length) =>
script mav {
input source = close;
input length = 14;
      def mav = ((SimpleMovingAvg(source, length)[1]*(length-1)) + source) / length;
    plot return = mav;
}
#Gaussianma(values, length) =>
script Gaussian {
    input values = close;
    input length = 20;
    def stddev = length / 4;
    def indices = length - 1;
    def weights = Exp(-0.5 * (Power((indices - length), 2) / Power(stddev, 2)));
    def sum = Sum(values * weights, length);
    def gMA = sum / Sum(weights, length);
    plot return = gMA;
}
#export mcginley(float src, simple int len)=>
script mcginley {
    input src = close;
    input len = 14;
    def mg;
    def t = ExpAverage(src, len);
    mg = CompoundValue(1 ,if IsNaN(mg[1]) then t else mg[1] + (src - mg[1]) / (len * Power(src / mg[1], 4)),t);
    plot return = mg;
}
# vawma(len, src = hlc3, len = na, startingWeight = 1) =>
Script vawma {
  input src = hlc3;
  input len = 5;
  input startingWeight = 1;
     def last = len -1;
    def vol = fold i1 = 0 to last with p1 do
              p1 + volume[i1] * (last - i1 + startingWeight);
    def sum = fold i2 = 0 to last with p2 do
              p2 + (src[i2] * volume[i2] * (last - i2 + startingWeight));
    def vawma = if vol == 0 then Double.NaN else sum/vol;
    plot out = vawma;
}
#trAdjEma(lengthy) =>
script TRAEM {
    input src = close;
    input length = 60;
    input mult = 1;
    def tr = TrueRange(high, close, low);
    def alpha = 2.0 / (length + 1);
    def trL = Lowest(tr, length);
    def trH = Highest(tr, length);
    def trAdj = if (trH - trL) != 0 then (tr - trL) / (trH - trL) else 0;
    def trEMA = ExpAverage(src, length);
    def trAdjEma;
    trAdjEma = CompoundValue(1, trAdjEma[1] + (alpha * (1 + (trAdj * mult)) * (src - trAdjEma[1])), trEMA);
    plot trAdEma = trAdjEma;
}

def na = Double.NaN;
DefineGlobalColor("up", CreateColor(63, 130, 112));
DefineGlobalColor("dn", CreateColor(255, 65, 108));

def bubble = SignalStyle==SignalStyle.Bubbles;
def arrow  = SignalStyle==SignalStyle.Arrows;
def v = volume;
def smoothrng = smoothrng(src, rangeFilterLength, rangeMulti);
def volrng = rngfilt_volumeadj(src, v, smoothrng);
def basetype = volrng;
def hband    = basetype + smoothrng;
def lowband  = basetype - smoothrng;
#// Filters
def SMA = SimpleMovingAvg(basetype, MovAvgLength);
def EMA = ExpAverage(basetype, MovAvgLength);
def SMMA = CompoundValue(1, if isNaN(SMMA[1]) then average(basetype, MovAvgLength) else
             (SMMA[1] * (MovAvgLength - 1) + basetype) / MovAvgLength,  average(basetype, MovAvgLength));
def MAV = MAV(basetype, MovAvgLength);
def VWMA = vwma(basetype, MovAvgLength);
def VAWMA = VAWMA(basetype, MovAvgLength);
def RMS   = RMS(basetype, MovAvgLength);
def McGinley = mcginley(basetype, MovAvgLength);
def Gaussian = Gaussian(basetype, MovAvgLength);
def TRAEM    = TRAEM(basetype, MovAvgLength, 1);

def Regline;
switch (MovAvgType) {
case "SMA"  : Regline = SMA;
case "EMA"  : Regline = EMA;
case "SMMA" : Regline = SMMA;
case "MAV"  : Regline = MAV;
case "VWMA" : Regline = VWMA;
case "VAWMA" : Regline = VAWMA;
case "RMS"  : Regline = RMS;
case "McGinley" : Regline = McGinley;
case "Gaussian" : Regline = Gaussian;
case "TRAEM"    : Regline = TRAEM;
}

# @regime_filter
def value1 = CompoundValue(1, 0.2 * (src - src[1]) + 0.8 * value1[1], 0.2 * (src - src[1]));
def value2 = CompoundValue(1, 0.1 * (high - low) + 0.8 * value2[1], 0.1 * (high - low));
def omega = AbsValue(value1 / value2);
def alpha = (-Power(omega, 2) + Sqrt(Power(omega, 4) + 16 * Power(omega, 2))) / 8;
def klmf = CompoundValue(1, alpha * src + (1 - alpha) * (klmf[1]), src);
def absCurveSlope = AbsValue(klmf - klmf[1]);
def Slope = 1.0 * ExpAverage(absCurveSlope, 200);
def normalized_slope_decline = (absCurveSlope - Slope) / Slope;
def regime = normalized_slope_decline >= - 0.5;
#volumeBreak(thres) =>
def rsivol   = RSI(Price = v, Length = FiltersLength);
def osc      = HullMovingAvg(rsivol, FiltersLength);
def volumeBreak = osc > 49;
#volatilityBreak(volmin, volmax)
def volmin = ATR(LENGTH = 1);
def volmax = ATR(LENGTH = FiltersLength);
def volatilityBreak = volmin > volmax;
#-- ADX
def adx = ADX(LENGTH = FiltersLength);
def adx_vwma = vwma(adx, FiltersLength);
def adx_filter = adx > adx_vwma;

def filter;
switch (FilterSignals) {
case "Volatility" :
    filter = volatilityBreak;
case "Volume" :
    filter = volumeBreak;
case "ADX" :
    filter = adx_filter;
case "Regime" :
    filter = regime;
case "All" :
    filter = (volatilityBreak and volumeBreak and adx_filter and regime);
case "None" :
    filter = yes;
}

#   // -- High/Low
def uptrend = trendUp(basetype);
def lowband_trendfollow  = Lowest(lowband, RangeSupertrendLength);
def highband_trendfollow = Highest(hband, RangeSupertrendLength);

def crossover  = Crosses(close,highband_trendfollow[1], CrossingDirection.ABOVE);
def crossunder = Crosses(close,lowband_trendfollow[1], CrossingDirection.BELOW);
def Barcrossover  = if crossover then 0 else Barcrossover[1] + 1;
def Barcrossunder = if crossunder then 0 else Barcrossunder[1] + 1;
def in_general_uptrend = Barcrossover < Barcrossunder;
def vwma_filter_positive = basetype > Regline;

def filterPos;
def filterNeg;
switch (useFilters) {
case "Moving Average":
    filterPos = vwma_filter_positive;
    filterNeg = !vwma_filter_positive;
case Supertrend :
    filterPos = in_general_uptrend;
    filterNeg = !in_general_uptrend;
case "Moving Avg & Supertrend" :
    filterPos = vwma_filter_positive and in_general_uptrend;
    filterNeg = !vwma_filter_positive and !in_general_uptrend;
case None :
    filterPos = yes;
    filterNeg = yes;
}
#    // -- VWMA
#//No negative needed
def crossBandUp = Crosses(close,hband, CrossingDirection.ABOVE);
def crossBandDn = Crosses(close,lowband, CrossingDirection.BELOW);
def b =  uptrend and crossBandUp and filterPos and filter;
def s = !uptrend and crossBandDn and filterNeg and filter;
def barB = if b then 0 else barB[1] + 1;
def barS = if s then 0 else barS[1] + 1;
def in_b = barB[1] < barS[1];
def in_s = barS[1] < barB[1];

plot VWMALine = if !showMovingAvgLine then na else Regline;          # "MovAvg"
VWMALine.SetLineWeight(2);
VWMALine.AssignValueColor(if uptrend then Color.CYAN else
                          if !uptrend then Color.MAGENTA else Color.GRAY);

plot mp = basetype;    # "Volume Range"
mp.SetDefaultColor(Color.WHITE);
plot bb = if !showSupertrend then na else
          if in_general_uptrend then lowband_trendfollow else na;    # "Bullish Trend Follow"
bb.SetDefaultColor(Color.GREEN);
plot uu = if !showSupertrend then na else
          if !in_general_uptrend then highband_trendfollow else na;  # "Bearish Trend Follow"
uu.SetDefaultColor(Color.RED);

def hp = hband;      # "High Range"
def lp = lowband;    # "Low Range"
def LongCon  = b and !in_b;
def ShortCon = s and !in_s;

AddCloud(if !highlighting then na else hp, mp, Color.DARK_GREEN);
AddCloud(if !highlighting then na else mp, lp, CreateColor(118, 106, 0));
AddCloud(if !highlighting then na else if in_general_uptrend then na else uu, hp, Color.DARK_RED);
AddCloud(if !highlighting then na else if !in_general_uptrend then na else lp, bb, CreateColor(0, 37, 139));

AddChartBubble(LongCon and bubble, low, "Buy", Color.GREEN, no);
AddChartBubble(ShortCon and bubble, high, "Sell", Color.RED, yes);

plot wedgUp = if LongCon and arrow then low else na;    # "Buy"
plot wedgDn = if ShortCon and arrow then high else na;   # "Sell"
wedgUp.SetPaintingStrategy(PaintingStrategy.ARROW_UP);
wedgDn.SetPaintingStrategy(PaintingStrategy.ARROW_DOWN);
wedgUp.SetDefaultColor(Color.CYAN);
wedgDn.SetDefaultColor(Color.MAGENTA);

AssignPriceColor(if !barColors then Color.CURRENT else
                 if uptrend then GlobalColor("up") else GlobalColor("dn"));

#--- END of CODE