Potential Explosion Indicator for ThinkorSwim

BenTen

Administrative
Staff member
Staff
VIP
Lifetime
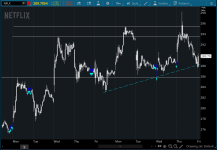
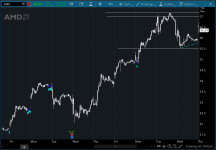
This script looks at times where MACD is within a specified range (very close to 0 values) and price action is very constrained (under 2%). Historically price has made a strong move after these conditions.

The arrows in this indicator doe not predict future movement. It's there in case you guys do not want to have the candles painted. And the arrows can also help in case you want to scan for new signals.

pf3xCyP.png

Hp97oBi.png


thinkScript Code

Code:
# Potential Explosion
# Assembled by BenTen at useThinkScript.com
# Converted from https://www.tradingview.com/script/rwBArbXJ-Explosive-Potential/

input fastLength = 12;
input slowLength = 26;
input MACDLength = 9;
input averageType = AverageType.EXPONENTIAL;
input showBreakoutSignals = no;

def Value = MovingAverage(averageType, close, fastLength) - MovingAverage(averageType, close, slowLength);
def Avg = MovingAverage(averageType, Value, MACDLength);

def Diff = Value - Avg;
def ZeroLine = 0;

input barsbackPrice = 15;
input priceThreshold = 0.6;
input barsbackMacd = 15;
input macdDiffThreshold = 9;
input macdValueThreshold = 6;

def highest = highest(close, barsbackPrice);
def lowest = lowest(close, barsbackPrice);

def macdLine = Value;

def priceVarianceBool = (absValue((highest - lowest) / lowest) * 100) < priceThreshold;
def macdDiffBool = absValue(highest(macdLine, barsbackMacd) - lowest(macdLine, barsbackMacd)) < macdDiffThreshold;
def macdRangeBool = macdLine < macdValueThreshold and macdLine > -macdValueThreshold;

def macdAndPriceFlat = macdDiffBool and macdRangeBool and priceVarianceBool;

assignPriceColor(if macdAndPriceFlat then color.blue else color.white);

plot arrow = macdAndPriceFlat;
arrow.SetPaintingStrategy(PaintingStrategy.BOOLEAN_ARROW_UP);
arrow.SetDefaultColor(Color.CYAN);
arrow.SetLineWeight(1);

See this comment If you wish to display only one arrow at the start of a consolidation range.
 

Attachments

  • pf3xCyP.png
    pf3xCyP.png
    85.1 KB · Views: 133
  • Hp97oBi.png
    Hp97oBi.png
    77.8 KB · Views: 144
Last edited:

Join useThinkScript to post your question to a community of 21,000+ developers and traders.

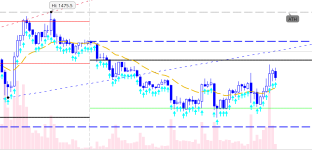
somehow i managed to turn every candle color and up arrow :eek:
dhPtmUG.png


15mins. Tried on 1H, same. Are you guys having this problem too?
 

Attachments

  • dhPtmUG.png
    dhPtmUG.png
    114.4 KB · Views: 125
I have the same problem as Playstation on AMZN chart. For SHOP it shows only arrow. Check this for date 12/13.

@BenTen I think this code change should fix the multiple arrow issue, change

Code:
plot arrow = macdAndPriceFlat;

to

Code:
plot arrow = macdAndPriceFlat and macdAndPriceFlat[1] is false;
 
@pk1729 Thank you for that. The arrows are added to each candlestick that has a tight MACD range. Also, it was designed to be used on the scanner as well. Using your method, we would have to increase the lookback period in the scanner. Aesthetic wise I can see why people would prefer to have a single arrow instead of a bunch within the same area. I have made a note about your snippet in the original thread in case anyone would prefer to have a single arrow at the beginning of the consolidation range.
 
@pk1729 Thank you for that. The arrows are added to each candlestick that has a tight MACD range. Also, it was designed to be used on the scanner as well. Using your method, we would have to increase the lookback period in the scanner. Aesthetic wise I can see why people would prefer to have a single arrow instead of a bunch within the same area. I have made a note about your snippet in the original thread in case anyone would prefer to have a single arrow at the beginning of the consolidation range.
Sorry to be dense here, but to use this as a scan, do I just set it to where the 'Arrow' = true? Doesn't seem to be working...
 
@ikpllc Correct. What is not working? Please post a screenshot of the error.
Ok, I believe I fixed it. Only other question is...in your opinion, what's the best time frame to use on the chart? I'm finding decent picks on the scan when I do 15 mins. Use 15 mins on the chart as well?
 

Similar threads

Not the exact question you're looking for?

Start a new thread and receive assistance from our community.

87k+ Posts
499 Online
Create Post

Similar threads

Similar threads

The Market Trading Game Changer

Join 2,500+ subscribers inside the useThinkScript VIP Membership Club
  • Exclusive indicators
  • Proven strategies & setups
  • Private Discord community
  • ‘Buy The Dip’ signal alerts
  • Exclusive members-only content
  • Add-ons and resources
  • 1 full year of unlimited support

Frequently Asked Questions

What is useThinkScript?

useThinkScript is the #1 community of stock market investors using indicators and other tools to power their trading strategies. Traders of all skill levels use our forums to learn about scripting and indicators, help each other, and discover new ways to gain an edge in the markets.

How do I get started?

We get it. Our forum can be intimidating, if not overwhelming. With thousands of topics, tens of thousands of posts, our community has created an incredibly deep knowledge base for stock traders. No one can ever exhaust every resource provided on our site.

If you are new, or just looking for guidance, here are some helpful links to get you started.

What are the benefits of VIP Membership?
VIP members get exclusive access to these proven and tested premium indicators: Buy the Dip, Advanced Market Moves 2.0, Take Profit, and Volatility Trading Range. In addition, VIP members get access to over 50 VIP-only custom indicators, add-ons, and strategies, private VIP-only forums, private Discord channel to discuss trades and strategies in real-time, customer support, trade alerts, and much more. Learn all about VIP membership here.
How can I access the premium indicators?
To access the premium indicators, which are plug and play ready, sign up for VIP membership here.
Back
Top