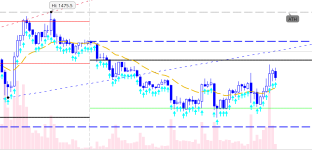
This script looks at times where MACD is within a specified range (very close to 0 values) and price action is very constrained (under 2%). Historically price has made a strong move after these conditions.
The arrows in this indicator doe not predict future movement. It's there in case you guys do not want to have the candles painted. And the arrows can also help in case you want to scan for new signals.
thinkScript Code
Code:
# Potential Explosion
# Assembled by BenTen at useThinkScript.com
# Converted from https://www.tradingview.com/script/rwBArbXJ-Explosive-Potential/

input fastLength = 12;
input slowLength = 26;
input MACDLength = 9;
input averageType = AverageType.EXPONENTIAL;
input showBreakoutSignals = no;

def Value = MovingAverage(averageType, close, fastLength) - MovingAverage(averageType, close, slowLength);
def Avg = MovingAverage(averageType, Value, MACDLength);

def Diff = Value - Avg;
def ZeroLine = 0;

input barsbackPrice = 15;
input priceThreshold = 0.6;
input barsbackMacd = 15;
input macdDiffThreshold = 9;
input macdValueThreshold = 6;

def highest = highest(close, barsbackPrice);
def lowest = lowest(close, barsbackPrice);

def macdLine = Value;

def priceVarianceBool = (absValue((highest - lowest) / lowest) * 100) < priceThreshold;
def macdDiffBool = absValue(highest(macdLine, barsbackMacd) - lowest(macdLine, barsbackMacd)) < macdDiffThreshold;
def macdRangeBool = macdLine < macdValueThreshold and macdLine > -macdValueThreshold;

def macdAndPriceFlat = macdDiffBool and macdRangeBool and priceVarianceBool;

assignPriceColor(if macdAndPriceFlat then color.blue else color.white);

plot arrow = macdAndPriceFlat;
arrow.SetPaintingStrategy(PaintingStrategy.BOOLEAN_ARROW_UP);
arrow.SetDefaultColor(Color.CYAN);
arrow.SetLineWeight(1);
See this comment If you wish to display only one arrow at the start of a consolidation range.
Attachments
Last edited: