This thread is really emotionally difficult for me to write, because prior to understanding the importance of position sizing, I took a string of losses at the beginning of my stock trading career that almost completely wiped me out. I'm hoping that my mistakes will help those of you reading this.
Contrary to popular belief, a strategy is
NOT the key to a consistently profitable trading career. Risk management is the key. I learned this lesson the hard way.
Like many traders, I had beginners luck. My first week trading, I took two trades in two days and earned $3,781.53.
1st Trade: ACRS 1,481 shares x $.33/share = $488.73 Profit
2nd Trade: VYGR 1,176 shares x $2.80/share = $3,292.80 Profit
I thought I was a genius, so then I started trading with bigger and bigger size and looser stop losses. Here were my results:
7th Trade: ICPT 387 shares x -$7.13/share = - $2,759.31 Loss
8th Trade: GDDY 581 shares x -$1.95/share = - $1,132.95 Loss
9th Trade: PHAS 2,400 shares x -$2.30/share = - $5,510.40 Loss
$9,402.66 in losses. I was devastated. I almost quit.
After several months of testing different risk management methods, I ultimately realized that the most appropriate way to manage risk is to establish a risk per trade. Risk per trade is the total amount of money you are willing to risk in a given trade. This is vitally important, because once you fund your trading account; determine your risk tolerance and establish your risk per trade, you are better equipped to take trades knowing that the probabilities are on your side, that will help prevent you from blowing up your account.
Example:
Let's say you're a day trader and you have an account balance of $1,000. Since you're under the $25,000 PDT (Pattern Day Trade) limit, you can only take 3 round trip trades/week. This means that your strategy has to have a statistical edge (you consistently win more than you lose); your winners must be twice or more as large as your losers on average and most importantly, you have to cap your risk per trade, otherwise you run the risk of blowing up your account - like I almost did

In this example, if it were me and I was a newbie trader, I wouldn't risk more than $10/trade. $10/trade allows you to lose without getting overly emotional and it also allows you to take 100 losses before your account dwindles to zero. 100 trades is generally the acceptable minimum number of trades that is required to determine if a trading strategy has a statistical edge. If you find that to be the case after taking 100 trades or backtesting 100 trades, you can increase your risk per share comfortably, because you would have confidence that your strategy wins more than it loses.
Now you're probably thinking... If my risk per trade is $10 and I can only take 3 trades/week because of the PDT Rule, my account will never grow. While it is true that your account will grow slowly, you have a few options to accelerate growth:
- Swing trade instead of day trade. This allows you to take more trades, with the caveat being that you have to hold your positions overnight for at least one 24 hour cycle. This goes without saying, but be careful holding small cap stocks overnight. Small cap companies are very volatile and may dramatically decrease in value overnight and in pre-market trading.
- Backtest (OnDemand or manual) or Paper trade your strategy instead of trading it with real money. If you already know that your strategy has a statistical edge from backtesting or Paper Trading, then there is no reason to trade with such a low risk per trade, as your strategy has already proven itself to be profitable - allowing you to responsibly take on a higher risk per trade.
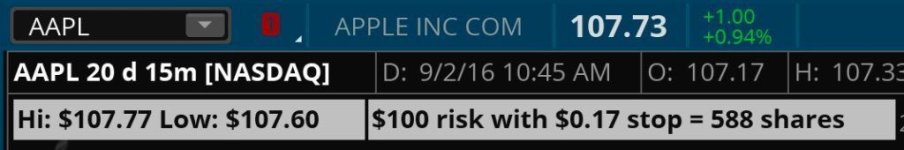
Now that you understand the importance of risk management, next, you need to understand how to calculate risk per trade in real-time. The formula I've provided below assumes that you are entering a trade when a new candle forms and price makes a new high above the previous candle's high. Your Stop Loss would be placed at the low of the previous candle.
Formula:
High = Insert the "High" price of the current candle
Low = Insert the "Low" price of the current candle
Qty = Risk Per Trade / Stop
Limit = Stop x Your Profit Target Multiple
Stop = High - Low
Provided below is an example trade for Facebook. The Entry Price, Qty, Limit and Stop that was entered in this order would yield a max loss of $29.97 if your stop was triggered, and a profit of $59.94 if your Limit was triggered.
The reason why this type of risk management method is so effective is because it allows you to cap your losses and pre-plan your profits. In my example, I've chosen a profit target multiple of 2, which gives me a reward to risk ratio of 2 : 1. If your strategy has a statistical edge that allows your winners to be twice the amount of your losers on average, this allows you to loss half of your trades and still be a profitable trader. It also allows you to loss 66% of your trades and still break even.
Problem:
So here's the BIG problem... If you're a day trader, momentum trader or trend trader that is trading on a 1 minute timeframe, you don't have time to manually calculate risk per trade, as this leads to panic, high blood pressure, error, hesitation and missed moves. By the time you manually calculate, the trade has likely already moved without you. An overwhelming majority of traders are faced with this issue, so they inevitably resort to one of the following:
- No risk management at all. No stop loss. No nothing - which leads to catastrophic losses
- Mental stops - which leads to an inability to pull the trigger... Which leads to catastrophic losses
- Uneven stops. They blindly put stops at the low of the previous candle without calculating the ratio of shares, which leads to larger losses, smaller profits and inconsistency in their P&L
To be blunt... If you're doing any of the above, you are not trading. You are gambling. You are hoping for an outcome that may or may not materialize, while leaving yourself vulnerable to virtually unlimited losses.
Solution:
It took me over 6 months before I finally realized that I needed to calculate risk per trade before entering into a position, and even when I realized this and accepted it, I was making calculations manually which led to a ton of errors and ultimately a ton of losses.
A month ago I finally broke down and purchased a Position Sizer. It does all of the work for you, and it even provides you with several options for calculating risk per trade, qty, entry price, stop, profit target, etc.
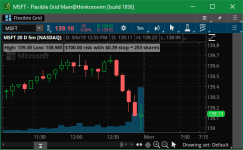
Checkout the screenshot below. It is the same screenshot as above with the exception that it has 4 boxes on the chart that provide all of the details I need to execute the trade. These boxes update in real-time based on the high and low price changes of the current candle. This makes it so easy for me to execute a trade, because now, all I have to do is type the values for each box into the Active Trader Ladder and then select the price I want to purchase on the Active Trader ladder and I'm in the trade.
What used to take me two minutes, now takes me less than 10 seconds!
Without this tool, I wouldn't be able to effectively trade 1 minute charts, which is an absolute requirement for my trading strategy.
It's important to note that I paid the developer an additional $30 to make a few customizations for me. The customizations I added are as follows:
- Added Heiken Ashi candle calculations
- Adjusted the names of the label fields to: Qty, Limit, Stop, Entry
- Changed the order of the labels to: Qty, Limit, Stop, Entry
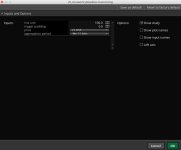
Inputs and Options:
Provided below is my current setup. I've only adjusted the fields with the red dot next to them. I left the remaining fields set to their defaults. As you can see, there are numerous options you can choose from to customize this tool to your liking.
I think the most beneficial setting you'll want to play with is the "Stop Type." You don't have to use the low of the current candle like I do. You can choose from the following Stop Types:
- ATR
- Kase
- $ Offset
- % Offset
- Fixed Price
If you adjust the Stop Type, you can select "Yes" under the "Plot Stops" Dropdown box. This is helpful because it shows you exactly where the Stop price is for every previous and current candle with a teal blue line. This allows you to backtest different Stops OnDemand to figure out what stop type is most optimal for your trading style, as well as the specific stock you're trading, which may have more or less volatility than others - which should be considered when determining your Stop Type. Provided below is a screenshot of an ATR Stop on a 1 minute chart.
I should also note that "Num Ticks Padding" is the buffer you want to add to your Limit and Stop order. As an example, if I entered .05 in this field, My Limit and Stop would both be set to $.05 above (Limit) and $.05 below (Stop) the current candles High and Low.
"Target Risk Multiple" is the multiple above your Stop you want your profit target to be. In my case, I've entered 6, which means I want my default Profit Target (Limit) to be 6 times higher than my Stop. It goes without saying, but all of my trades aren't that profitable (6 : 1 Reward to Risk Ratio). However, I like to leave myself a big buffer just in case a big spike in price occurs - allowing me to make a bigger move.
"Fixed Dollar Amount" is my risk per trade. In this example, I have set a value of $30. This means that my share size and stop offset will automatically be calculated to ensure that I lose a maximum of $30 if my stop loss is triggered. This goes without saying, but if price plummets quickly without stopping on my stop price, my loss could be more than $30. This is rare though. When it does happen, it's never more than 5%. If this happens, it's not the fault of the tool or the broker. It's all due to price action, supply and demand dynamics.
"Show Labels" are the labels on my chart: Qty, Limit, Stop, Entry
ATR Stop Loss Example:
The teal blue line on the chart below is a 1.5 ATR Stop on a 1M chart. An ATR Stop is extremely helpful, because it allows you to avoid false stop outs from stop hunters as well as overall market volatility, as the 1.5 ATR takes into account price volatility based on the average true range of price action.
In the example below, there are several good places to enter long positions on this stock. However, if you used the low of the current candle for your Stop, there are many places where you would have prematurely gotten stopped out because price briefly dips below your Stop price, but then shoots up higher within 5 - 10 candles later.
An ATR stop allows you to be a little more sloppy with Stops and get away with it. It also increases the length of your Stop though. As an example, if the ATR Stop is twice the length of a low of the current candle stop, price has to go up twice as much to make the same profit. This is why I don't use ATR Stops and instead use the low of the current candle stop. It's riskier. However, my analysis for my strategy indicates that in the long-term, my profits will be larger using a low of the current candle stop, as opposed to an ATR stop. To each their own.
I've talked a lot about day trading in this post. I want to emphasize that this isn't just useful for day trading. It's extremely useful for Swing Trading as well, and all of the same pointers I've mentioned above still apply.
I hope this was helpful, and I hope you consider purchasing this tool. Don't be a cheapskate like me by trying to calculate position size manually or not at all. I was so cheap that I even made a post here back in September, trying to see if there was a free version of a tool similar to this one. No such tool exists. I lost a lot of money trying to do what this tool does automatically. This was the best investment I've made in my trading career.
As of the writing of this post, the developer is
selling the script for $109.99.
Feel free to ask me any questions and I'll answer them as best as I can. You can also email the developer. He's pretty responsive.