johnwood34
Member
https://usethinkscript.com/threads/bill-williams-fractal-indicator-for-thinkorswim.600/
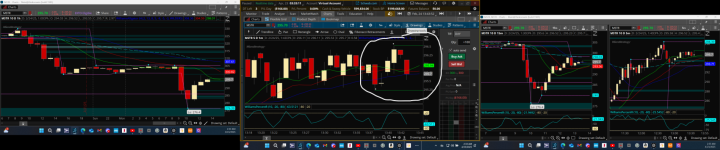
I love this script but would like, if at all possible, for it to plot only the most recent fractal high and low, as well as a horizontal line that stretches out to the right of the fractals. I've also attached a screenshot for reference. I'd like it to plot exactly like the circled price action. i hope this is enough info to work with. I'm not quite sure what else to add. Just remove the horistic fractals and plot a horizontal line along with the dots for the most recent fractal high and low. If you zoom in, to the right and left on higher time frames, the historic is burdensome to look at...
I love this script but would like, if at all possible, for it to plot only the most recent fractal high and low, as well as a horizontal line that stretches out to the right of the fractals. I've also attached a screenshot for reference. I'd like it to plot exactly like the circled price action. i hope this is enough info to work with. I'm not quite sure what else to add. Just remove the horistic fractals and plot a horizontal line along with the dots for the most recent fractal high and low. If you zoom in, to the right and left on higher time frames, the historic is burdensome to look at...