# monitor_x_symbols_compare_spy
#new
#https://usethinkscript.com/threads/plot-indicator-on-spy-chart-if-bars-on-other-tickers-are-in-agreement.15780/
#--------------------------
def na = double.nan;
def bn = barnumber();
input Symbol1 = "TSLA";
def agg1 = AggregationPeriod.five_min;
def s1o = open(Symbol1, period = agg1);
def s1c = close(Symbol1, period = agg1);
input Symbol2 = "QQQ";
def agg2 = AggregationPeriod.five_min;
def s2o = open(Symbol2, period = agg2);
def s2c = close(Symbol2, period = agg2);
input Symbol3 = "SPY";
def agg3 = AggregationPeriod.five_min;
def s3o = open(Symbol3, period = agg3);
def s3c = close(Symbol3, period = agg3);
input Symbol4 = "SPY";
def agg4 = AggregationPeriod.five_min;
def s4o = open(Symbol4, period = agg4);
def s4c = close(Symbol4, period = agg4);
input Symbol5 = "SPY";
def agg5 = AggregationPeriod.five_min;
def s5o = open(Symbol5, period = agg5);
def s5c = close(Symbol5, period = agg5);
input exclude_symbol = "SPY";
def s1ok = if Symbol1 == exclude_symbol then 0 else 1;
def s2ok = if Symbol2 == exclude_symbol then 0 else 1;
def s3ok = if Symbol3 == exclude_symbol then 0 else 1;
def s4ok = if Symbol4 == exclude_symbol then 0 else 1;
def s5ok = if Symbol5 == exclude_symbol then 0 else 1;
def cntok = s1ok + s2ok + s3ok + s4ok + s5ok;
def s1up = s1ok and s1c > s1o;
def s2up = s2ok and s2c > s2o;
def s3up = s3ok and s3c > s3o;
def s4up = s4ok and s4c > s4o;
def s5up = s5ok and s5c > s5o;
def s1dwn = s1ok and s1c < s1o;
def s2dwn = s2ok and s2c < s2o;
def s3dwn = s3ok and s3c < s3o;
def s4dwn = s4ok and s4c < s4o;
def s5dwn = s5ok and s5c < s5o;
#-------------
# inputs - below bars
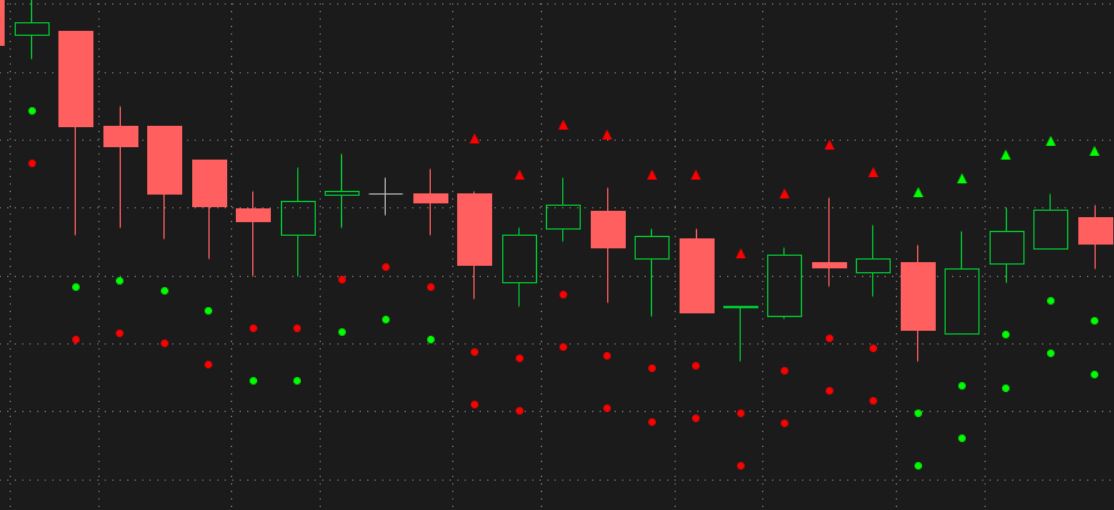
input show_input_dots = yes;
def vert = 0.0004;
plot z1 = if show_input_dots and s1ok then low * (1 - (1*vert)) else na;
z1.SetPaintingStrategy(PaintingStrategy.POINTS);
z1.SetLineWeight(3);
z1.AssignValueColor(if s1up then Color.GREEN else if s1dwn then Color.RED else Color.GRAY);
z1.hidebubble();
plot z2 = if show_input_dots and s2ok then low * (1 - (2*vert)) else na;
z2.SetPaintingStrategy(PaintingStrategy.POINTS);
z2.SetLineWeight(3);
z2.AssignValueColor(if s2up then Color.GREEN else if s2dwn then Color.RED else Color.GRAY);
z2.hidebubble();
plot z3 = if show_input_dots and s3ok then low * (1 - (3*vert)) else na;
z3.SetPaintingStrategy(PaintingStrategy.POINTS);
z3.SetLineWeight(3);
z3.AssignValueColor(if s3up then Color.GREEN else if s3dwn then Color.RED else Color.GRAY);
z3.hidebubble();
plot z4 = if show_input_dots and s4ok then low * (1 - (4*vert)) else na;
z4.SetPaintingStrategy(PaintingStrategy.POINTS);
z4.SetLineWeight(3);
z4.AssignValueColor(if s4up then Color.GREEN else if s4dwn then Color.RED else Color.GRAY);
z4.hidebubble();
plot z5 = if show_input_dots and s5ok then low * (1 - (5*vert)) else na;
z5.SetPaintingStrategy(PaintingStrategy.POINTS);
z5.SetLineWeight(3);
z5.AssignValueColor(if s5up then Color.GREEN else if s5dwn then Color.RED else Color.GRAY);
z5.hidebubble();
#-------------------------
# output - above bars
def outup = (s1ok and s1up) + (s2ok and s2up) + (s3ok and s3up) + (s4ok and s4up) + (s5ok and s5up);
def outdwn = (s1ok and s1dwn) + (s2ok and s2dwn) + (s3ok and s3dwn) + (s4ok and s4dwn) + (s5ok and s5dwn);
input show_output_dot = yes;
plot zz1 = if show_output_dot and ((outup == cntok) or (outdwn == cntok)) then high * (1 + (1*vert)) else na;
zz1.SetPaintingStrategy(PaintingStrategy.triangles);
zz1.SetLineWeight(3);
zz1.AssignValueColor(if (outup == cntok) then Color.GREEN else if (outdwn == cntok) then Color.RED else Color.GRAY);
zz1.hidebubble();
#------------------
addlabel(1, " ", color.black);
input show_labels = yes;
addlabel(show_labels and s1ok, Symbol1, color.yellow);
addlabel(show_labels and s2ok, Symbol2, color.yellow);
addlabel(show_labels and s3ok, Symbol3, color.yellow);
addlabel(show_labels and s4ok, Symbol4, color.yellow);
addlabel(show_labels and s5ok, Symbol5, color.yellow);
#