this seems to work,
draw 2 horizontal lines during a trade. (between the buy and sell signals)
a buy signal is when ema8 crosses above ema21.
a green arrow is drawn.
2 horizontal lines are drawn during the trade, 1 for target, 1 for stop.
when price crosses a line, the 2 lines stop and a square is drawn. either green above, or red below.
if another buy signal happens during a trade, it draws a cyan arrow.
can enter a formula for the target and stop levels. defaults,
def t = (body_top + ((body_top - low) * 2));
def s = low;
sometimes a cyan arrows appear, but no lines. it might be because the next bar canceled the trade. or something to do with looking at previous bars to end the trade.
Code:
# target_stoploss_levels
#https://usethinkscript.com/threads/plot-further-target-and-stop-loss-levels-until-price-breaks-these-levels.16916/
#Plot Further target and stop loss levels until price breaks these levels
def na = double.nan;
def bn = barnumber();
def body_top = max(open,close);
def body_bot = min(open,close);
#------------------------
# data
def price = close;
input MA1_len = 8;
input MA1_type = AverageType.EXPONENTIAL;
def ma1 = MovingAverage(ma1_type, price, ma1_len);
input MA2_len = 21;
input MA2_type = AverageType.EXPONENTIAL;
def ma2 = MovingAverage(ma2_type, price, ma2_len);
input show_data_lines = yes;
plot m1 = if show_data_lines then ma1 else na;
plot m2 = if show_data_lines then ma2 else na;
m1.SetDefaultColor(Color.light_gray);
m1.hidebubble();
m2.SetDefaultColor(Color.light_gray);
m2.hidebubble();
#------------------------
# signals
# Plot up arrow when ema1 crosses above ema2
def crossup = ma1 crosses above ma2;
#def crossdwn = ma1 crosses below ma2;
#------------------------
# target level formula
def t = (body_top + ((body_top - low) * 2));
# stop level formula
def s = low;
#------------------------
# create levels on every crossup
def stop0 = if bn == 1 then s else if crossup then low else stop0[1];
def target0 = if bn == 1 then t else if crossup then t else stop0[1];
#------------------------
# continue lines and ignore new signals
# stop both lines if a stop is crossed
def off1 = 1;
# stop level , 0 or $$ level
def stop1 = if bn == 1 then 0
else if crossup and stop1[1] == 0 then stop0
# stop trade
# look at high[1] so line extends to bar that crosses line
else if stop1[1] > 0 and low[off1] < stop1[1] then 0
# start trade
# else if crossup and stop1[1] == 0 then stop0
# continue trade
else stop1[1];
#-----------------------
def target1 = if bn == 1 then 0
else if crossup and target1[1] == 0 then target0
# stop trade
# look at high[1] so line extends to bar that crosses line
else if (target1[1] > 0 and high[off1] > target1[1]) or stop1 == 0 then 0
# start trade
# else if crossup and target1[1] == 0 then target0
# continue trade
else target1[1];
#-----------------------
# 2nd stop formula, to look at the target level
# stop level , 0 or $$ level
def stop2 = if bn == 1 then 0
else if stop1 == 0 or target1 == 0 then 0
else if low[1] < stop2[1] then 0
else if target1 != target1[1] then s
else stop2[1];
# 2nd target formula, to look at the target level
# stop level , 0 or $$ level
def target2 = if bn == 1 then 0
else if target1 == 0 or stop2 == 0 then 0
else if low[1] < stop2[1] then 0
else if stop2 != stop2[1] then t
else target2[1];
#------------------------
# plot horz lines
plot z1 = if target2 > 0 then target2 else na;
z1.SetDefaultColor(Color.cyan);
plot z2 = if stop2 > 0 then stop2 else na;
z2.SetDefaultColor(Color.cyan);
#-----------------------
def vert1 = 0.001;
# trade start - up signal, green up arrow
plot zcrossup = if crossup and target2 != target2[1] then (low*(1-vert1)) else na;
zcrossup.setPaintingStrategy(paintingStrategy.ARROW_UP);
zcrossup.SetDefaultColor(Color.green);
zcrossup.setlineweight(4);
zcrossup.hidebubble();
# up signal during a trade, cyan arrow
plot zcrossup2 = if crossup and target2 == target2[1] then (low*(1-vert1)) else na;
zcrossup2.setPaintingStrategy(paintingStrategy.ARROW_UP);
zcrossup2.SetDefaultColor(Color.cyan);
zcrossup2.setlineweight(2);
zcrossup2.hidebubble();
# trade ended up, green square
plot stopup = if high > target2 and target2 > 0 then (high*(1+vert1)) else na;
stopup.setPaintingStrategy(paintingStrategy.squares);
stopup.SetDefaultColor(Color.green);
stopup.setlineweight(4);
stopup.hidebubble();
# trade ended down, red square
plot stopdwn = if low < stop2 and stop2 > 0 then (low*(1-vert1)) else na;
stopdwn.setPaintingStrategy(paintingStrategy.squares);
stopdwn.SetDefaultColor(Color.red);
stopdwn.setlineweight(4);
stopdwn.hidebubble();
#-----------------------
addchartbubble(0, low*0.997,
stop0 + " S0\n" +
stop1 + " S1\n" +
stop2 + " S2\n" +
target0 + " T0\n" +
target1 + " T1\n" +
target2 + " T2\n"
, color.yellow, no);
addchartbubble(0, low,
stop0 + "\n" +
stop1 + "\n" +
stop2
, color.yellow, no);
addchartbubble(0, low*0.998,
crossup + " xup\n" +
(crossup and target1[1] == 0) + "\n" +
target1 + " t1\n" +
stop1 + " s1\n"
, (if crossup then color.yellow else color.gray), no);
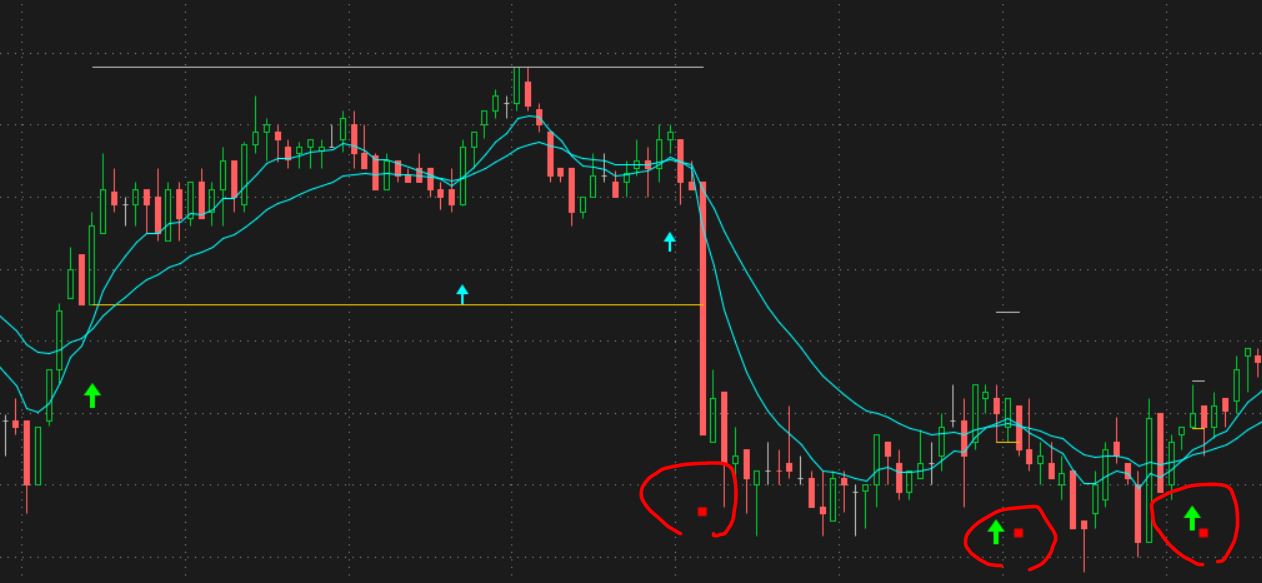
#
green arrow at start of trade
2 lines during trade
cyan arrow when another buy signal
red square below bar, when price crosses below stop signal
( if price crosses above target line, then a green square above)