Looking for help with code change to continue to plot target and stop loss levels until the price of further candles breaks one of these two levels. Also there should not be another signal if there is an active signal already in place.
Your help is much appreciated
Code:
# Define exponential moving averages
plot ema1 = MovAvgExponential(close, 8);
plot ema2 = MovAvgExponential(close, 21);

# Plot arrows when ema1 crosses above ema2
plot crossup = ema1 crosses above ema2;
crossup.setPaintingStrategy(paintingStrategy.BOOLEAN_ARROW_UP);

# Define the stop loss and target levels
def stopLossLevel = if crossup then low else double.nan;
def targetLevel = if crossup then close + (close - low) * 2 else double.nan;

# Plot stop loss level dynamically until price breaks
plot sl = if !IsNaN(stopLossLevel) then low else double.nan;
sl.SetPaintingStrategy(PaintingStrategy.HORIZONTAL);
sl.SetDefaultColor(Color.RED);
sl.SetLineWeight(2);

# Plot target level dynamically until price breaks
plot tl = if !IsNaN(targetLevel) then close + (close - low) * 2 else double.nan;
tl.SetPaintingStrategy(PaintingStrategy.HORIZONTAL);
tl.SetDefaultColor(Color.GREEN);
tl.SetLineWeight(2);
Looking for help with code change to continue to plot target and stop loss levels until the price of further candles breaks one of these two levels. Also there should not be another signal if there is an active signal already in place.
Your help is much appreciated
Code:
# Define exponential moving averages
plot ema1 = MovAvgExponential(close, 8);
plot ema2 = MovAvgExponential(close, 21);

# Plot arrows when ema1 crosses above ema2
plot crossup = ema1 crosses above ema2;
crossup.setPaintingStrategy(paintingStrategy.BOOLEAN_ARROW_UP);

# Define the stop loss and target levels
def stopLossLevel = if crossup then low else double.nan;
def targetLevel = if crossup then close + (close - low) * 2 else double.nan;

# Plot...
Looking for help with code change to continue to plot target and stop loss levels until the price of further candles breaks one of these two levels. Also there should not be another signal if there is an active signal already in place.
Your help is much appreciated
Code:
# Define exponential moving averages
plot ema1 = MovAvgExponential(close, 8);
plot ema2 = MovAvgExponential(close, 21);

# Plot arrows when ema1 crosses above ema2
plot crossup = ema1 crosses above ema2;
crossup.setPaintingStrategy(paintingStrategy.BOOLEAN_ARROW_UP);

# Define the stop loss and target levels
def stopLossLevel = if crossup then low else double.nan;
def targetLevel = if crossup then close + (close - low) * 2 else double.nan;

# Plot stop loss level dynamically until price breaks
plot sl = if !IsNaN(stopLossLevel) then low else double.nan;
sl.SetPaintingStrategy(PaintingStrategy.HORIZONTAL);
sl.SetDefaultColor(Color.RED);
sl.SetLineWeight(2);

# Plot target level dynamically until price breaks
plot tl = if !IsNaN(targetLevel) then close + (close - low) * 2 else double.nan;
tl.SetPaintingStrategy(PaintingStrategy.HORIZONTAL);
tl.SetDefaultColor(Color.GREEN);
tl.SetLineWeight(2);
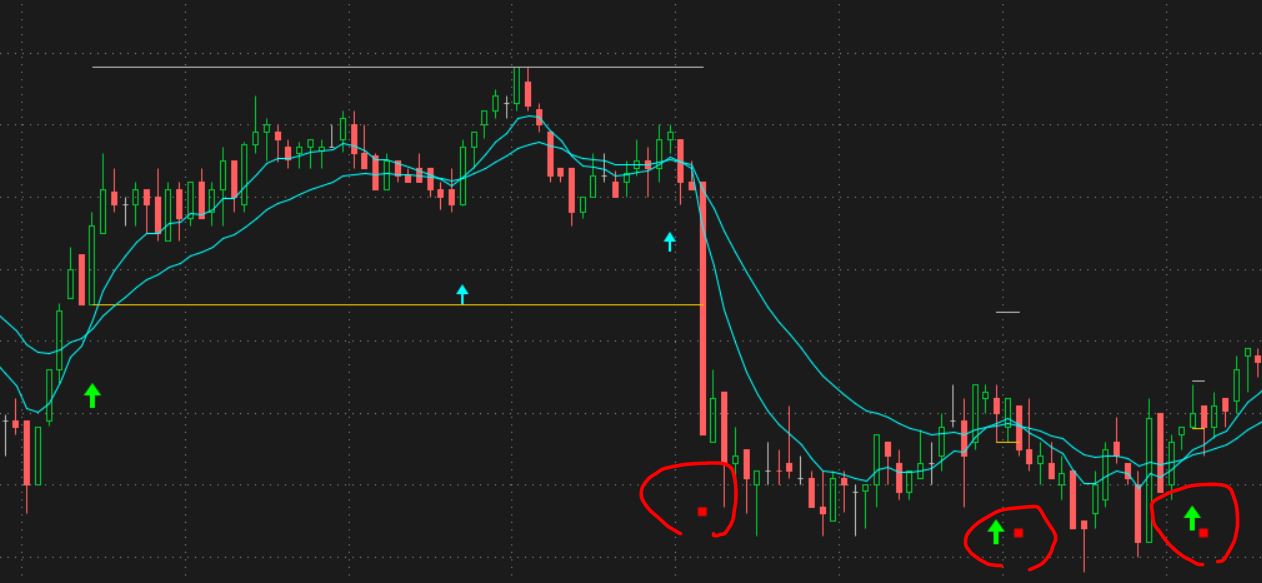
this seems to work,
draw 2 horizontal lines during a trade. (between the buy and sell signals)
a buy signal is when ema8 crosses above ema21.
a green arrow is drawn.
2 horizontal lines are drawn during the trade, 1 for target, 1 for stop.
when price crosses a line, the 2 lines stop and a square is drawn. either green above, or red below.
if another buy signal happens during a trade, it draws a cyan arrow.
can enter a formula for the target and stop levels. defaults,
def t = (body_top + ((body_top - low) * 2));
def s = low;
sometimes a cyan arrows appear, but no lines. it might be because the next bar canceled the trade. or something to do with looking at previous bars to end the trade.
Code:
# target_stoploss_levels

#https://usethinkscript.com/threads/plot-further-target-and-stop-loss-levels-until-price-breaks-these-levels.16916/
#Plot Further target and stop loss levels until price breaks these levels

def na = double.nan;
def bn = barnumber();

def body_top = max(open,close);
def body_bot = min(open,close);

#------------------------
# data
def price = close;
input MA1_len = 8;
input MA1_type =  AverageType.EXPONENTIAL;
def ma1 = MovingAverage(ma1_type, price, ma1_len);
input MA2_len = 21;
input MA2_type =  AverageType.EXPONENTIAL;
def ma2 = MovingAverage(ma2_type, price, ma2_len);

input show_data_lines = yes;
plot m1 = if show_data_lines then ma1 else na;
plot m2 = if show_data_lines then ma2 else na;
m1.SetDefaultColor(Color.light_gray);
m1.hidebubble();
m2.SetDefaultColor(Color.light_gray);
m2.hidebubble();

#------------------------
# signals
# Plot up arrow when ema1 crosses above ema2
def crossup = ma1 crosses above ma2;
#def crossdwn = ma1 crosses below ma2;

#------------------------
# target level formula
def t = (body_top + ((body_top - low) * 2));

# stop level formula
def s = low;

#------------------------
# create levels on every crossup
def stop0 = if bn == 1 then s else if crossup then low else stop0[1];
def target0 = if bn == 1 then t else if crossup then t else stop0[1];

#------------------------
# continue lines and ignore new signals
# stop both lines if a stop is crossed
def off1 = 1;
# stop level , 0 or $$ level
def stop1 = if bn == 1 then 0
 else if crossup and stop1[1] == 0 then stop0
# stop trade
# look at high[1] so line extends to bar that crosses line
 else if stop1[1] > 0 and low[off1] < stop1[1] then 0
# start trade
# else if crossup and stop1[1] == 0 then stop0
# continue trade
 else stop1[1];

#-----------------------

def target1 = if bn == 1 then 0
 else if crossup and target1[1] == 0 then target0
# stop trade
# look at high[1] so line extends to bar that crosses line
 else if (target1[1] > 0 and high[off1] > target1[1]) or stop1 == 0 then 0
# start trade
# else if crossup and target1[1] == 0 then target0
# continue trade
 else target1[1];

#-----------------------

# 2nd stop formula, to look at the target level
# stop level , 0 or $$ level
def stop2 = if bn == 1 then 0
 else if stop1 == 0 or target1 == 0 then 0
 else if low[1] < stop2[1] then 0
 else if target1 != target1[1] then s
 else stop2[1];


# 2nd target formula, to look at the target level
# stop level , 0 or $$ level
def target2 = if bn == 1 then 0
 else if target1 == 0 or stop2 == 0 then 0
 else if low[1] < stop2[1] then 0
 else if stop2 != stop2[1] then t
 else target2[1];

#------------------------
# plot horz lines
plot z1 = if target2 > 0 then target2 else na;
z1.SetDefaultColor(Color.cyan);
plot z2 = if stop2 > 0 then stop2 else na;
z2.SetDefaultColor(Color.cyan);

#-----------------------
def vert1 = 0.001;

# trade start - up signal, green up arrow
plot zcrossup = if crossup and target2 != target2[1] then (low*(1-vert1)) else na;
zcrossup.setPaintingStrategy(paintingStrategy.ARROW_UP);
zcrossup.SetDefaultColor(Color.green);
zcrossup.setlineweight(4);
zcrossup.hidebubble();

# up signal during a trade, cyan arrow
plot zcrossup2 = if crossup and target2 == target2[1] then (low*(1-vert1)) else na;
zcrossup2.setPaintingStrategy(paintingStrategy.ARROW_UP);
zcrossup2.SetDefaultColor(Color.cyan);
zcrossup2.setlineweight(2);
zcrossup2.hidebubble();


# trade ended up, green square
plot stopup = if high > target2 and target2 > 0 then (high*(1+vert1)) else na;
stopup.setPaintingStrategy(paintingStrategy.squares);
stopup.SetDefaultColor(Color.green);
stopup.setlineweight(4);
stopup.hidebubble();

# trade ended down, red square
plot stopdwn = if low < stop2 and stop2 > 0 then (low*(1-vert1)) else na;
stopdwn.setPaintingStrategy(paintingStrategy.squares);
stopdwn.SetDefaultColor(Color.red);
stopdwn.setlineweight(4);
stopdwn.hidebubble();


#-----------------------
addchartbubble(0, low*0.997,
stop0 + "  S0\n" +
stop1 + "  S1\n" +
stop2 + "  S2\n" +
target0 + "  T0\n" +
target1 + "  T1\n" +
target2 + "  T2\n"
, color.yellow, no);


addchartbubble(0, low,
stop0 + "\n" +
stop1 + "\n" +
stop2
, color.yellow, no);


addchartbubble(0, low*0.998,
crossup + " xup\n" +
(crossup and target1[1] == 0) + "\n" +
target1 + " t1\n" +
stop1 + " s1\n"
, (if crossup then color.yellow else color.gray), no);
#
green arrow at start of trade
2 lines during trade
cyan arrow when another buy signal
red square below bar, when price crosses below stop signal
( if price crosses above target line, then a green square above)
useThinkScript is the #1 community of stock market investors using indicators and other tools to power their trading strategies. Traders of all skill levels use our forums to learn about scripting and indicators, help each other, and discover new ways to gain an edge in the markets.
How do I get started?
We get it. Our forum can be intimidating, if not overwhelming. With thousands of topics, tens of thousands of posts, our community has created an incredibly deep knowledge base for stock traders. No one can ever exhaust every resource provided on our site.
If you are new, or just looking for guidance, here are some helpful links to get you started.
VIP members get exclusive access to these proven and tested premium indicators: Buy the Dip, Advanced Market Moves 2.0, Take Profit, and Volatility Trading Range. In addition, VIP members get access to over 50 VIP-only custom indicators, add-ons, and strategies, private VIP-only forums, private Discord channel to discuss trades and strategies in real-time, customer support, trade alerts, and much more. Learn all about VIP membership here.
How can I access the premium indicators?
To access the premium indicators, which are plug and play ready, sign up for VIP membership here.