Plot 1hr high close

shakib3585

Active member
VIP
Greetings,

I'm seeking the high and close values of the very last one-hour bar from the trading session two days ago and would like to represent them as horizontal lines on a chart. If there was a post-market session for a specific ticker symbol on that day, then that data will be included as well.

Your help is much appreciated.

Thank you.
 
This should work on aggregation charts less than input agg period with at least a timeframe of input daysback + 1 or more.

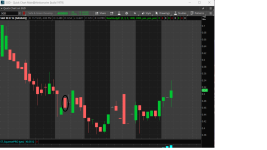
The image shows a 1hr bar chart in the upper pane and a 5m chart in the lower pane with the same lines for both.
Can you modify this for last hour of the previous trading day? So from 1500-1600 show this area with a cloud bubble of lines?
 

Join useThinkScript to post your question to a community of 21,000+ developers and traders.

This provides an option to only display the lines on the current day for the prior day's highs/lows.

There are 3 prior day's included in the code. More day's can be created using the logic for the 3 days and changing the values for each day.

The image shows in the upper chart the showtodayonly option and below is without this option.
Thank you @SleepyZ
 
Can you modify this for last hour of the previous trading day? So from 1500-1600 show this area with a cloud bubble of lines?

The images show the same script with showtodayonly set to NO in the upper and YES in the lower

Screenshot 2023-11-09 055554.png

Code:
script hl {
    input daysback = 2;
    input ORBegin = 1500;
    input OREnd   = 1600;

    def na = Double.NaN;

    input CloudOn = yes;

    input ShowTodayOnly = yes;

# Create logic for OR definition:
    def days     = if GetYYYYMMDD() != GetYYYYMMDD()[1] then days[1] + 1 else days[1];
    def daycount = HighestAll(days) - days;
    def ORActive = if daycount == daysback  and SecondsTillTime(OREnd) > 0 and SecondsFromTime(ORBegin) >= 0 then 1 else 0;

#High/Low starting at orbegin1 using Opening Range Script modified to use last hour
     def h1500 = if SecondsFromTime(1500)[1] < 0 and SecondsFromTime(1500) >= 0 then high(period = AggregationPeriod.HOUR) else h1500[1];
    def l1500 = if SecondsFromTime(1500)[1] < 0 and SecondsFromTime(1500) >= 0 then low(period = AggregationPeriod.HOUR) else l1500[1];

    def orhigh = if ORActive then h1500 else orhigh[1];
    def orLow  = if ORActive then l1500 else orLow[1];

# Define all the plots:
    plot ORH = if ShowTodayOnly and GetDay() != GetLastDay() then na else orhigh;
    plot ORL = if ShowTodayOnly and GetDay() != GetLastDay() then na else orLow;

# end Script
}

def bn = barnumber();
DefineGlobalColor("H", Color.GREEN);
DefineGlobalColor("L", Color.RED);
DefineGlobalColor("Cloud", Color.GRAY);

input back1 = 1;
input back2 = 2;
input back3 = 3;

input cloudon = yes;
input showtodayonly = yes;
input showprice_in_bubble = yes;

plot rh1 = hl(back1, "cloud on" = cloudon, "show today only" = showtodayonly).ORH;
plot rl1 = hl(back1, "cloud on" = cloudon, "show today only" = showtodayonly).ORL;

# Formatting:

rh1.SetDefaultColor(GlobalColor("H"));
rh1.SetPaintingStrategy(PaintingStrategy.HORIZONTAL);
rh1.SetLineWeight(1);
rl1.SetDefaultColor(GlobalColor("L"));
rl1.SetPaintingStrategy(PaintingStrategy.HORIZONTAL);
rl1.SetLineWeight(1);

AddCloud(if cloudon then rh1 else double.nan, rl1, GlobalColor("Cloud"), GlobalColor("Cloud"));

AddChartBubble(bn==highestall(bn), rh1, if showprice_in_bubble then "H1 " + round(rh1) else "H1", rh1.TakeValueColor());
AddChartBubble(bn==highestall(bn), rl1, if showprice_in_bubble then "L1 " + round(rl1) else "L1", rl1.TakeValueColor());

plot rh2 = hl(back2, "cloud on" = cloudon, "show today only" = showtodayonly).ORH;
plot rl2 = hl(back2, "cloud on" = cloudon, "show today only" = showtodayonly).ORL;

# Formatting:

rh2.SetDefaultColor(GlobalColor("H"));
rh2.SetPaintingStrategy(PaintingStrategy.HORIZONTAL);
rh2.SetLineWeight(1);
rl2.SetDefaultColor(GlobalColor("L"));
rl2.SetPaintingStrategy(PaintingStrategy.HORIZONTAL);
rl2.SetLineWeight(1);

AddCloud(if cloudOn then rh2 else double.nan, rl2, GlobalColor("Cloud"), GlobalColor("Cloud"));

AddChartBubble(bn==highestall(bn), rh2, if showprice_in_bubble then "H2 " + round(rh2) else "H2", rh2.TakeValueColor());
AddChartBubble(bn==highestall(bn), rl2, if showprice_in_bubble then "L2 " + round(rl2) else "L2", rl2.TakeValueColor());

plot rh3 = hl(back3, "cloud on" = cloudon, "show today only" = showtodayonly).ORH;
plot rl3 = hl(back3, "cloud on" = cloudon, "show today only" = showtodayonly).ORL;

# Formatting:

rh3.SetDefaultColor(GlobalColor("H"));
rh3.SetPaintingStrategy(PaintingStrategy.HORIZONTAL);
rh3.SetLineWeight(1);
rl3.SetDefaultColor(GlobalColor("L"));
rl3.SetPaintingStrategy(PaintingStrategy.HORIZONTAL);
rl3.SetLineWeight(1);

AddCloud(if cloudOn then rh3 else double.nan, rl3, GlobalColor("Cloud"), GlobalColor("Cloud"));

AddChartBubble(bn==highestall(bn), rh3, if showprice_in_bubble then "H3 " + round(rh3) else "H3" , rh3.TakeValueColor());
AddChartBubble(bn==highestall(bn), rl3, if showprice_in_bubble then "L3 " + round(rl3) else "L3" , rl3.TakeValueColor());

#
 
The images show the same script with showtodayonly set to NO in the upper and YES in the lower
Hello @SleepyZ , Can you please help me with the above code to modify it to find the high, low, and close of the second last bar from two days ago? For example, if today is 11/14/23, then I would like to get the high, low, and close of the second last bar before the market closes on 11/12/23. The aggregation period is one hour and should include post-market data, if available.

Thank you very much

This adds the ability to input the orbegin and orend times at the input screen as well as adding the close as a plot.

Screenshot 2023-11-15 062940.png
Code:
script hl {
    input daysback = 2;
    input ORBegin = 1400;
    input OREnd   = 1500;

    def na = Double.NaN;

    input CloudOn = yes;

    input ShowTodayOnly = yes;

# Create logic for OR definition:
    def days     = if GetYYYYMMDD() != GetYYYYMMDD()[1] then days[1] + 1 else days[1];
    def daycount = HighestAll(days) - days;
    def ORActive = if daycount == daysback  and SecondsTillTime(OREnd) > 0 and SecondsFromTime(ORBegin) >= 0 then 1 else 0;

#High/Low starting at orbegin1 using Opening Range Script modified to use last hour
    def h1500 = if SecondsFromTime(ORBegin)[1] < 0 and SecondsFromTime(ORBegin) >= 0 then high(period = AggregationPeriod.HOUR) else h1500[1];
    def l1500 = if SecondsFromTime(ORBegin)[1] < 0 and SecondsFromTime(ORBegin) >= 0 then low(period = AggregationPeriod.HOUR) else l1500[1];
    def cc1500 = if SecondsFromTime(ORBegin)[1] < 0 and SecondsFromTime(ORBegin) >= 0 then close(period = AggregationPeriod.HOUR) else cc1500[1];

    def orhigh = if ORActive then h1500 else orhigh[1];
    def orLow  = if ORActive then l1500 else orLow[1];
    def orClose  = if ORActive then cc1500 else orClose[1];

# Define all the plots:
    plot ORH = if ShowTodayOnly and GetDay() != GetLastDay() then na else orhigh;
    plot ORL = if ShowTodayOnly and GetDay() != GetLastDay() then na else orLow;
    plot ORC = if ShowTodayOnly and GetDay() != GetLastDay() then na else orClose;

# end Script
}

def bn = BarNumber();
DefineGlobalColor("H", Color.GREEN);
DefineGlobalColor("L", Color.RED);
DefineGlobalColor("C", Color.white);
DefineGlobalColor("Cloud", Color.GRAY);

input back1 = 1;
input back2 = 2;
input back3 = 3;
input orbegin = 1400;
input orend   = 1500;

input cloudon = yes;
input showtodayonly = yes;
input showprice_in_bubble = yes;

plot rh1 = hl(back1, orbegin, orend, "cloud on" = cloudon, "show today only" = showtodayonly).ORH;
plot rl1 = hl(back1, orbegin, orend, "cloud on" = cloudon, "show today only" = showtodayonly).ORL;
plot rc1 = hl(back1, orbegin, orend, "cloud on" = cloudon, "show today only" = showtodayonly).ORC;

# Formatting:

rh1.SetDefaultColor(GlobalColor("H"));
rh1.SetPaintingStrategy(PaintingStrategy.HORIZONTAL);
rh1.SetLineWeight(1);
rl1.SetDefaultColor(GlobalColor("L"));
rl1.SetPaintingStrategy(PaintingStrategy.HORIZONTAL);
rl1.SetLineWeight(1);
rc1.SetDefaultColor(GlobalColor("C"));
rc1.SetPaintingStrategy(PaintingStrategy.HORIZONTAL);
rc1.SetLineWeight(1);


AddCloud(if cloudon then rh1 else Double.NaN, rl1, GlobalColor("Cloud"), GlobalColor("Cloud"));

AddChartBubble(bn == HighestAll(bn), rh1, if showprice_in_bubble then "H1 " + Round(rh1) else "H1", rh1.TakeValueColor());
AddChartBubble(bn == HighestAll(bn), rl1, if showprice_in_bubble then "L1 " + Round(rl1) else "L1", rl1.TakeValueColor(), no);
AddChartBubble(bn == HighestAll(bn), rc1, if showprice_in_bubble then "C1 " + Round(rc1) else "C1", rc1.TakeValueColor());

plot rh2 = hl(back2, orbegin, orend, "cloud on" = cloudon, "show today only" = showtodayonly).ORH;
plot rl2 = hl(back2, orbegin, orend, "cloud on" = cloudon, "show today only" = showtodayonly).ORL;
plot rc2 = hl(back2, orbegin, orend, "cloud on" = cloudon, "show today only" = showtodayonly).ORC;

# Formatting:

rh2.SetDefaultColor(GlobalColor("H"));
rh2.SetPaintingStrategy(PaintingStrategy.HORIZONTAL);
rh2.SetLineWeight(1);
rl2.SetDefaultColor(GlobalColor("L"));
rl2.SetPaintingStrategy(PaintingStrategy.HORIZONTAL);
rl2.SetLineWeight(1);
rc2.SetDefaultColor(GlobalColor("C"));
rc2.SetPaintingStrategy(PaintingStrategy.HORIZONTAL);
rc2.SetLineWeight(1);

AddCloud(if cloudon then rh2 else Double.NaN, rl2, GlobalColor("Cloud"), GlobalColor("Cloud"));

AddChartBubble(bn == HighestAll(bn), rh2, if showprice_in_bubble then "H2 " + Round(rh2) else "H2", rh2.TakeValueColor());
AddChartBubble(bn == HighestAll(bn), rl2, if showprice_in_bubble then "L2 " + Round(rl2) else "L2", rl2.TakeValueColor(), no);
AddChartBubble(bn == HighestAll(bn), rc2, if showprice_in_bubble then "C2 " + Round(rc2) else "C2", rc2.TakeValueColor());

plot rh3 = hl(back3, orbegin, orend, "cloud on" = cloudon, "show today only" = showtodayonly).ORH;
plot rl3 = hl(back3, orbegin, orend, "cloud on" = cloudon, "show today only" = showtodayonly).ORL;
plot rc3 = hl(back3, orbegin, orend, "cloud on" = cloudon, "show today only" = showtodayonly).ORC;

# Formatting:

rh3.SetDefaultColor(GlobalColor("H"));
rh3.SetPaintingStrategy(PaintingStrategy.HORIZONTAL);
rh3.SetLineWeight(1);
rl3.SetDefaultColor(GlobalColor("L"));
rl3.SetPaintingStrategy(PaintingStrategy.HORIZONTAL);
rl3.SetLineWeight(1);
rc3.SetDefaultColor(GlobalColor("C"));
rc3.SetPaintingStrategy(PaintingStrategy.HORIZONTAL);
rc3.SetLineWeight(1);

AddCloud(if cloudon then rh3 else Double.NaN, rl3, GlobalColor("Cloud"), GlobalColor("Cloud"));

AddChartBubble(bn == HighestAll(bn), rh3, if showprice_in_bubble then "H3 " + Round(rh3) else "H3" , rh3.TakeValueColor());
AddChartBubble(bn == HighestAll(bn), rl3, if showprice_in_bubble then "L3 " + Round(rl3) else "L3" , rl3.TakeValueColor(), no);
AddChartBubble(bn == HighestAll(bn), rc3, if showprice_in_bubble then "C3 " + Round(rc3) else "C3", rc3.TakeValueColor());

#
 
This adds the ability to input the orbegin and orend times at the input screen as well as adding the close as a plot.
Hello @SleepyZ , Thank you for the response. What I intended was to find the high, low, and close of the black circled bar in the image below. The black circled bar is the second-last bar from two days ago with respect to today. The ticker is SGD. Please note that if there is no post-market data for any given ticker, then the bar at 02:00–03:00 pm EDT will be the second last bar for that stock ticker. If possible, I would request to have the option to do this at any given aggregation with the same principle.

Thank you
 

Attachments

  • plot.png
    plot.png
    186 KB · Views: 113
Hello @SleepyZ , Can you please help me with the above code to modify it to find the high, low, and close of the second last bar from two days ago? For example, if today is 11/14/23, then I would like to get the high, low, and close of the second last bar before the market closes on 11/12/23. The aggregation period is one hour and should include post-market data, if available.

Thank you very much

To do this, you need a mod to not the above code, but to an earlier code that focused on the last bar of the day rather than an input time period.

So this should do what you want. It allows you to choose the daysback and barsback from the last bar of the day.

Screenshot 2023-11-16 092037.png
Code:
#Plot the ending prices (high and close) of the most recent one-hour trading bar from two days ago

input daysback = 2;
input barsback = 1;
input agg      = AggregationPeriod.HOUR;

#Days Defined
def ymd      = GetYYYYMMDD();
def candles  = !IsNaN(close);
def capture  = candles and ymd != ymd[1];
def dayCount = CompoundValue(1, if capture then dayCount[1] + 1 else dayCount[1], 0);
def thisDay  = (HighestAll(dayCount) - dayCount) ;
def bn       = barnumber();
def thisbar  = if thisDay == daysback and thisDay[-1] == daysback - 1 then bn - barsback else double.nan;

#Bar Prior to Last Close of Agg Period Bar on Daysback
def close_agg = if IsNaN(close) then close_agg[1] else if thisDay == daysback and thisDay[-1] == daysback - 1 then close(period = agg)[barsback] else close_agg[1];
#Plot Extended to Right Edge
plot barpriortolastclose_agg = if bn <= highestall(thisbar) then double.nan else close_agg;
barpriortolastclose_agg.SetPaintingStrategy(PaintingStrategy.HORIZONTAL);

#Bar Prior to Last High of Agg Period Bar on Daysback
def high_agg = if IsNaN(close) then high_agg[1] else if thisDay == daysback and thisDay[-1] == daysback - 1 then high(period = agg)[barsback] else high_agg[1];
#Plot Extended to Right Edge
plot barpriortolasthigh_agg = if bn <= highestall(thisbar) then double.nan else high_agg;
barpriortolasthigh_agg.SetPaintingStrategy(PaintingStrategy.HORIZONTAL);

#Bar Prior to Last Low of Agg Period Bar on Daysback
def low_agg = if IsNaN(close) then low_agg[1] else if thisDay == daysback and thisDay[-1] == daysback - 1 then low(period = agg)[barsback] else low_agg[1];
#Plot Extended to Right Edge
plot barpriortolastlow_agg = if bn <= highestall(thisbar) then double.nan else low_agg;
barpriortolastlow_agg.SetPaintingStrategy(PaintingStrategy.HORIZONTAL);

input bubble      = yes;
input bubblemover = 3;
def b  = bubblemover;
def b1 = b + 1;
AddChartBubble(bubble and IsNaN(close[b]) and !IsNaN(close[b1]), barpriortolastclose_agg[b1], "PLC", barpriortolastclose_agg.TakeValueColor());
AddChartBubble(bubble and IsNaN(close[b]) and !IsNaN(close[b1]), barpriortolasthigh_agg[b1], "PLH", barpriortolasthigh_agg.TakeValueColor());
AddChartBubble(bubble and IsNaN(close[b]) and !IsNaN(close[b1]), barpriortolastlow_agg[b1], "PLL", barpriortolastlow_agg.TakeValueColor(), no);

#
 
Hello @SleepyZ ,

I need your help with plotting high, low, and close prices based on a specific aggregation and setback period. Essentially, I want to display these prices as constants throughout the post-market session, irrespective of bar changes. For instance, if I want the high, low, and close prices from a specific previous hourly bar, I'd like to plot them continuously until the end of the current post-market session, regardless of whether the specific previous hourly bar is from the same day or a previous one. Could you assist me in scripting this?

Thank you
 
Last edited by a moderator:
Hello @SleepyZ ,

I need your help with plotting high, low, and close prices based on a specific aggregation and setback period. Essentially, I want to display these prices as constants throughout the post-market session, irrespective of bar changes. For instance, if I want the high, low, and close prices from a specific previous hourly bar, I'd like to plot them continuously until the end of the current post-market session, regardless of whether the specific previous hourly bar is from the same day or a previous one. Could you assist me in scripting this?

Thank you

This will allow you to locate the bar by date/time or barnumber

Screenshot 2023-11-29 064540.png
Code:
input method      = {default datetime, bar};

input date        = 20231122;
input time        = 1800;
input barnumber   = 400;
input aggregation = AggregationPeriod.HOUR;

def bn = BarNumber();
def datetime_bar = if getyyyYMMDD()==date and secondsfromtime(time)==0 then bn else datetime_bar[1];
def methodbar = if method==method.datetime then datetime_bar else barnumber;

def h = high(period = aggregation);
def c = close(period = aggregation);
def l = low(period = aggregation);
def lastrthbar = if GetDay() == GetLastDay() and SecondsFromTime(1600) == 0 then bn else Double.NaN;

def hext  = if bn == methodbar then h else hext[1];
plot hbar = if bn < HighestAll(lastrthbar) then hext[1] else Double.NaN;
hbar.SetPaintingStrategy(PaintingStrategy.HORIZONTAL);

def lext  = if bn == methodbar then l else lext[1];
plot lbar = if bn < HighestAll(lastrthbar) then lext[1] else Double.NaN;
lbar.SetPaintingStrategy(PaintingStrategy.HORIZONTAL);

def cext  = if bn == methodbar then c else cext[1];
plot cbar = if bn < HighestAll(lastrthbar) then cext[1] else Double.NaN;
cbar.SetPaintingStrategy(PaintingStrategy.HORIZONTAL);

input showbubbles = yes;
input bubblemover = 3;
def b1 = bubblemover + 1;
def mover = showbubbles and bn == HighestAll(lastrthbar + bubblemover);

AddChartBubble(mover , hbar[b1], "H " + AsText(hbar[b1]), hbar.TakeValueColor());
AddChartBubble(mover , lbar[b1], "L " + AsText(lbar[b1]), lbar.TakeValueColor(), no);
AddChartBubble(mover , cbar[b1], "C " + AsText(cbar[b1]), cbar.TakeValueColor());
 
This will allow you to locate the bar by date/time or barnumber
Hello @SleepyZ ,

Thank you very much for your help. I believe you have made an easier version for the high, low, and close prices of the previous days (code attached), but it does not work if the previous bar is from the same day. The reason I say it is easier is because you can just increase the daysback and barsback and get it faster. I plan to use this code during active trading, and I would greatly appreciate it if the following code could be modified for the current day as well.

Thanks again


Code:
#Plot the ending prices (high and close) of the most recent one-hour trading bar from two days ago

input daysback = 2;
input barsback = 1;
input agg      = AggregationPeriod.HOUR;

#Days Defined
def ymd      = GetYYYYMMDD();
def candles  = !IsNaN(close);
def capture  = candles and ymd != ymd[1];
def dayCount = CompoundValue(1, if capture then dayCount[1] + 1 else dayCount[1], 0);
def thisDay  = (HighestAll(dayCount) - dayCount) ;
def bn       = barnumber();
def thisbar  = if thisDay == daysback and thisDay[-1] == daysback - 1 then bn - barsback else double.nan;

#Bar Prior to Last Close of Agg Period Bar on Daysback
def close_agg = if IsNaN(close) then close_agg[1] else if thisDay == daysback and thisDay[-1] == daysback - 1 then close(period = agg)[barsback] else close_agg[1];


#Bar Prior to Last High of Agg Period Bar on Daysback
def high_agg = if IsNaN(close) then high_agg[1] else if thisDay == daysback and thisDay[-1] == daysback - 1 then high(period = agg)[barsback] else high_agg[1];


#Bar Prior to Last Low of Agg Period Bar on Daysback
def low_agg = if IsNaN(close) then low_agg[1] else if thisDay == daysback and thisDay[-1] == daysback - 1 then low(period = agg)[barsback] else low_agg[1];
#Plot Extended to Right Edge


def tph = high_agg;
def tpl = low_agg;
def cl = close_agg;


plot a1 = tph;
plot a2 = tpl;
plot a3 = cl;
 
Hello @SleepyZ ,

I am trying to plot any given previous day's Value Area High, Value Area Low and Point of control using the corresponding previous day's volume profile. I believe I have a code from you that shows the same above but only for the previous day (attached). I know you are a pioneer in extracting any previous day's high, low and close data and as such , I am requesting you can you please modify the attached code to find the VAH, VAL and POC of any desired previous day and at any desired aggregation. If possible, please modify the code using a getback number ( for example, if getback is 1 then that indicates for the previous day) so as I can also use the code in my scanner.

Many Thanks
Code:
rec count1 = CompoundValue(1, if !(GetDay() != GetDay()[1]) then count1[1] + 1 else 1, 1);
def priorperiod = if IsNaN(count1[1]) then 1 else Max(count1, count1[1]);
profile vol1 = VolumeProfile("startNewProfile" = GetDay() != GetDay()[1], "onExpansion" = no);

def vahprior = vol1.GetHighestValueArea();
def pocprior = vol1.GetPointOfControl();
def valprior = vol1.GetLowestValueArea();

def vahprev = GetValue(vahprior, priorperiod);
def pocprev = GetValue(pocprior, priorperiod);
def valprev = GetValue(valprior, priorperiod);

def tph = vahprev;
def pvo = pocprev;
def tpl = valprev;


One issue about the above attached code. I see the values of PVAH, PVAL and POC are different for different intraday period at the same aggregation. For example, the PVAH, PVAL and POC values for ADTX on 12/15/2023, I see different numbers between "5D:1m" aggregation and "30D:1m" aggregation. Also, while using the code today for the tickr VRCA, the values at 11 am EST were significantly different than the same at 12 pm EST , both at "5D:1m" aggregation. Can you please help to resolve the issue @SleepyZ .

Thank you
 
Last edited by a moderator:
Hello @SleepyZ ,

I am trying to plot any given previous day's Value Area High, Value Area Low and Point of control using the corresponding previous day's volume profile. I believe I have a code from you that shows the same above but only for the previous day (attached). I know you are a pioneer in extracting any previous day's high, low and close data and as such , I am requesting you can you please modify the attached code to find the VAH, VAL and POC of any desired previous day and at any desired aggregation. If possible, please modify the code using a getback number ( for example, if getback is 1 then that indicates for the previous day) so as I can also use the code in my scanner.

Many Thanks
Code:
rec count1 = CompoundValue(1, if !(GetDay() != GetDay()[1]) then count1[1] + 1 else 1, 1);
def priorperiod = if IsNaN(count1[1]) then 1 else Max(count1, count1[1]);
profile vol1 = VolumeProfile("startNewProfile" = GetDay() != GetDay()[1], "onExpansion" = no);

def vahprior = vol1.GetHighestValueArea();
def pocprior = vol1.GetPointOfControl();
def valprior = vol1.GetLowestValueArea();

def vahprev = GetValue(vahprior, priorperiod);
def pocprev = GetValue(pocprior, priorperiod);
def valprev = GetValue(valprior, priorperiod);

def tph = vahprev;
def pvo = pocprev;
def tpl = valprev;


One issue about the above attached code. I see the values of PVAH, PVAL and POC are different for different intraday period at the same aggregation. For example, the PVAH, PVAL and POC values for ADTX on 12/15/2023, I see different numbers between "5D:1m" aggregation and "30D:1m" aggregation. Also, while using the code today for the tickr VRCA, the values at 11 am EST were significantly different than the same at 12 pm EST , both at "5D:1m" aggregation. Can you please help to resolve the issue @SleepyZ .

Thank you

This code that I had posted, with a modified input from daysback to getback, may help do the 3 primary volumeprofile timeframes (Day, Week and Month). The option to showtoday only will show the getback timeframe's profiles VAH, POC and VAL lines on today's chart.

Screenshot 2023-12-15 134733.png
Code:
#Volumeprofile_POC_VAH_VAL_Extended_Plots_to_RightAxis

input getback         = 0;
input showontodayonly = yes;
input timeframe = {default "DAY", "WEEK", "MONTH"};
def ymd      = if timeframe == timeframe."MONTH"
               then GetMonth()
               else if timeframe == timeframe."WEEK"
               then GetWeek()
               else GetYYYYMMDD();
def candles  = !IsNaN(close);
def capture  = candles and ymd != ymd[1];
def dayCount = CompoundValue(1, if capture then dayCount[1] + 1 else dayCount[1], 0);
def thisDay  = (HighestAll(dayCount) - dayCount) ;

def poc      = if IsNaN(close)
               then poc[1]
               else if thisDay == getback then reference VolumeProfile("time per profile" = timeframe, "on expansion" = no)
               else poc[1];
def vahigh   = if IsNaN(close)
               then vahigh[1]
               else if thisDay == getback then reference VolumeProfile("time per profile" = timeframe, "on expansion" = no).VAHigh
               else vahigh[1];
def valow    = if IsNaN(close)
               then valow[1]
               else if thisDay == getback then reference VolumeProfile("time per profile" = timeframe, "on expansion" = no).VALow
                else valow[1];

plot poc1    = if thisDay > getback or
                  showontodayonly and GetDay() != GetLastDay()
               then Double.NaN
               else poc;
plot vahigh1 = if thisDay > getback or
                  showontodayonly and GetDay() != GetLastDay()
               then Double.NaN
               else vahigh;
plot valow1  = if thisDay > getback or
                  showontodayonly and GetDay() != GetLastDay()
               then Double.NaN
               else valow;

poc1.SetDefaultColor(Color.CYAN);
vahigh1.SetDefaultColor(Color.YELLOW);
valow1.SetDefaultColor(Color.YELLOW);

input bubblemover = 3;
def b  = bubblemover;
def b1 = b + 1;
input showbubbles = yes;
AddChartBubble(showbubbles and IsNaN(close[b]) and !IsNaN(close[b1]), poc1[b1],
(if timeframe == timeframe."MONTH"
then "M"
else if timeframe == timeframe."WEEK"
then "W"
else "D") + "POC - " + getback, Color.CYAN);
AddChartBubble(showbubbles and IsNaN(close[b]) and !IsNaN(close[b1]), vahigh1[b1],
(if timeframe == timeframe."MONTH"
then "M"
else if timeframe == timeframe."WEEK"
then "W"
else "D") + "VAH - " + getback, Color.YELLOW);
AddChartBubble(showbubbles and IsNaN(close[b]) and !IsNaN(close[b1]), valow1[b1],
(if timeframe == timeframe."MONTH"
then "M"
else if timeframe == timeframe."WEEK"
then "W"
else "D") + "VAL - " + getback, Color.YELLOW);

Regarding the differences you are seeing, I have found that the profiles can have usually minor differences, if any, between displays on different timeframe settings. I usually test any code by displaying the standard TOS volumeprofile on the same chart as the coded one. They usually line up. Any differences then between the comparison of timeframes is likely how TOS computes the VAH, POC and VAL. We do not have access to this process.

Here is an example of the above code lining up within each of the 2 timeframes with the TOS standard Volumeprofile, However, the code and the TOS standard Volumeprofile does not match exactly between the 2 charts.

 
Last edited:
This code that I had posted, with a modified input from daysback to getback, may help do the 3 primary volumeprofile timeframes (Day, Week and Month). The option to showtoday only will show the getback timeframe's profiles VAH, POC and VAL lines on today's chart.


Regarding the differences you are seeing, I have found that the profiles can have usually minor differences, if any, between displays on different timeframe settings. I usually test any code by displaying the standard TOS volumeprofile on the same chart as the coded one. They usually line up. Any differences then between the comparison of timeframes is likely how TOS computes the VAH, POC and VAL. We do not have access to this process.

Here is an example of the above code lining up within each of the 2 timeframes with the TOS standard Volumeprofile, However, the code and the TOS standard Volumeprofile does not match exactly between the 2 charts.
Thank you so much @SleepyZ . It works like a charm. Also, I would like to mention that I applied your code for ADTX using a getback of 4 days with Daily Aggregation. You will be surprised to see that the values that I am getting for PVAH, PVAL and POC using "5D:1m" are 3.87, 3.51, and 3.73. For the same get-back using a "30D:1m" aggregation, I am seeing 3.93, 3.52 and 3.68. In bare eyes, these differences may not be much, but if you use them for calculating Fibonacci pivots, the levels cause a significant drift. Can you please help me to resolve this? Thank you
 
Thank you so much @SleepyZ . It works like a charm. Also, I would like to mention that I applied your code for ADTX using a getback of 4 days with Daily Aggregation. You will be surprised to see that the values that I am getting for PVAH, PVAL and POC using "5D:1m" are 3.87, 3.51, and 3.73. For the same get-back using a "30D:1m" aggregation, I am seeing 3.93, 3.52 and 3.68. In bare eyes, these differences may not be much, but if you use them for calculating Fibonacci pivots, the levels cause a significant drift. Can you please help me to resolve this? Thank you

Sorry, I am not surprised. I tried to explain this problem in the above post.

This is an issue with TOS's standard Volumeprofile. The source code is not available to determine how they compute these values. Try putting the standard indicator and the code I provided on the same chart with the same settings and see if there are any differences.
Thanks a ton @SleepyZ
 
Hello @SleepyZ , I have been working with your code with the chart, and it's awesome. Thank you. Two queries, please...

1) I attempted a comparison with a "week" timeframe using 2-day getback and noticed significant differences in PVAH, PVAL, and POC values between the "30D:1m" and "Max:W" aggregations for the stock ticker PIXY. Specifically, under PIXY, with the "30D:1m" aggregation and a "Week" timeframe with a 2-day getback, the POC, PVAH, and PVAL were observed as 13.08, 13.69, and 8.21 respectively. However, in the "Max:W" aggregation, these values differed greatly to 0, 6651.4, and -6651.4. I see the values using "30D:1m" aggregation were right. I realized the values can be different based on the unknown internal calculations of TOS, but I'm uncertain which aggregation should be applied as a filter in my scanner. For instance, if I opt to filter based on the current close being 1.1 times higher than the previous week's POC, should I use a "week" aggregation in the scanner, despite the substantial alterations in values?

2) Can you please include the plot of the closing price based on the getback and aggregation period.

I am trying my best to sort it out by myself but my limited knowledge compared to yours prevents me to solve the issue by myself. Please help.

Thank you very much

I do not understand what "Max:W" is. I would suggest that whatever chart you use, then use the same aggregation timeframe in both the chart and the scanner. I do not use the scanner except when coding for others, so my assistance may be limited.

The chart that you use this code on should match the volumeprofile set to same settings as the code below.

Make sure that the chart you use has enough data to display the whole getback period. The code is reliant on that data to be on the chart you are using.

The image displays both the code below and the volumeprofile indicator for verification.

The close associated with the last bar of the getback aggregation period used has been added to the code below.

Screenshot 2023-12-17 075849.png

Code:
#Volumeprofile_POC_VAH_VAL_Extended_Plots_to_RightAxis

input getback         = 0;
input showontodayonly = yes;
input timeframe = {default "DAY", "WEEK", "MONTH"};
def ymd      = if timeframe == timeframe."MONTH"
               then GetMonth()
               else if timeframe == timeframe."WEEK"
               then GetWeek()
               else GetYYYYMMDD();
def candles  = !IsNaN(close);
def capture  = candles and ymd != ymd[1];
def dayCount = CompoundValue(1, if capture then dayCount[1] + 1 else dayCount[1], 0);
def thisDay  = (HighestAll(dayCount) - dayCount) ;

def poc      = if IsNaN(close)
               then poc[1]
               else if thisDay == getback then reference VolumeProfile("time per profile" = timeframe, "on expansion" = no)
               else poc[1];
def vahigh   = if IsNaN(close)
               then vahigh[1]
               else if thisDay == getback then reference VolumeProfile("time per profile" = timeframe, "on expansion" = no).VAHigh
               else vahigh[1];
def valow    = if IsNaN(close)
               then valow[1]
               else if thisDay == getback then reference VolumeProfile("time per profile" = timeframe, "on expansion" = no).VALow
                else valow[1];

plot poc1    = if thisDay > getback or
                  showontodayonly and GetDay() != GetLastDay()
               then Double.NaN
               else poc;
plot vahigh1 = if thisDay > getback or
                  showontodayonly and GetDay() != GetLastDay()
               then Double.NaN
               else vahigh;
plot valow1  = if thisDay > getback or
                  showontodayonly and GetDay() != GetLastDay()
               then Double.NaN
               else valow;

poc1.SetDefaultColor(Color.CYAN);
vahigh1.SetDefaultColor(Color.YELLOW);
valow1.SetDefaultColor(Color.YELLOW);

input bubblemover = 3;
def b  = bubblemover;
def b1 = b + 1;
input showbubbles = yes;
AddChartBubble(showbubbles and IsNaN(close[b]) and !IsNaN(close[b1]), poc1[b1],
(if timeframe == timeframe."MONTH"
then "M"
else if timeframe == timeframe."WEEK"
then "W"
else "D") + "POC - " + getback, Color.CYAN);
AddChartBubble(showbubbles and IsNaN(close[b]) and !IsNaN(close[b1]), vahigh1[b1],
(if timeframe == timeframe."MONTH"
then "M"
else if timeframe == timeframe."WEEK"
then "W"
else "D") + "VAH - " + getback, Color.YELLOW);
AddChartBubble(showbubbles and IsNaN(close[b]) and !IsNaN(close[b1]), valow1[b1],
(if timeframe == timeframe."MONTH"
then "M"
else if timeframe == timeframe."WEEK"
then "W"
else "D") + "VAL - " + getback, Color.YELLOW);

def c = if isnan(close) then c[1] else if thisday==getback then close else c[1];

plot getbackclose = if thisDay > getback or
                    showontodayonly and GetDay() != GetLastDay()
                    then Double.NaN
                    else c;
getbackclose.setpaintingStrategy(paintingStrategy.DASHES);
getbackclose.setdefaultColor(color.magenta);

AddChartBubble(showbubbles and IsNaN(close[b]) and !IsNaN(close[b1]), c[b1],
(if timeframe == timeframe."MONTH"
then "M"
else if timeframe == timeframe."WEEK"
then "W"
else "D") + "Close - " + getback, getbackclose.takevaluecolor());

#
 
I do not understand what "Max:W" is. I would suggest that whatever chart you use, then use the same aggregation timeframe in both the chart and the scanner. I do not use the scanner except when coding for others, so my assistance may be limited.

The chart that you use this code on should match the volumeprofile set to same settings as the code below.

Make sure that the chart you use has enough data to display the whole getback period. The code is reliant on that data to be on the chart you are using.

The image displays both the code below and the volumeprofile indicator for verification.

The close associated with the last bar of the getback aggregation period used has been added to the code below.
Thank you very much for the code, @SleepyZ . The "Max:W" is the same as "30D:1m" excpet; here "Max" means the maximum number of the intraday period it can cover for a "week" aggregation in terms of data. You can check that if "Max:W" is selected then the values get drastically changed. I also agree if I use the "30D:1m" aggregation, then it shows the correct PVAH, PVAL and POC data but I am unsure if I should use the code on a "week" aggregation filter scanner and use it after seeing the values get changed
 

Attachments

  • save.gif
    save.gif
    27.4 KB · Views: 86
Thank you very much for the code, @SleepyZ . The "Max:W" is the same as "30D:1m" excpet; here "Max" means the maximum number of the intraday period it can cover for a "week" aggregation in terms of data. You can check that if "Max:W" is selected then the values get drastically changed. I also agree if I use the "30D:1m" aggregation, then it shows the correct PVAH, PVAL and POC data but I am unsure if I should use the code on a "week" aggregation filter scanner and use it after seeing the values get changed
Hello @SleepyZ , I tried the attached code to scan stocks based on a month aggregation, but none appeared. I see that the tikr IVVD satisfied the criteria but was not caught by the filter even though it satisfied. Can you please suggest.

Thank you
Code:
def ymd      =  GetMonth();
def candles  = !IsNaN(close);
def capture  = candles and ymd != ymd[1];
def dayCount = CompoundValue(1, if capture then dayCount[1] + 1 else dayCount[1], 0);
def thisDay  = (HighestAll(dayCount) - dayCount) ;

def poc      = if IsNaN(close)
               then poc[1]
               else if thisDay == 1 then reference VolumeProfile("time per profile" = "Month", "on expansion" = no)
               else poc[1];
def vahigh   = if IsNaN(close)
               then vahigh[1]
               else if thisDay == 1 then reference VolumeProfile("time per profile" = "Month", "on expansion" = no).VAHigh
               else vahigh[1];
def valow    = if IsNaN(close)
               then valow[1]
               else if thisDay == 1 then reference VolumeProfile("time per profile" = "Month", "on expansion" = no).VALow
                else valow[1];

def poc1    =  poc;
def vahigh1 =  vahigh;
def valow1  =  valow;


def tph = vahigh1;
def pvo = poc1;
def tpl = valow1;
  

plot scan = close>=pvo;
 

Similar threads

Not the exact question you're looking for?

Start a new thread and receive assistance from our community.

87k+ Posts
200 Online
Create Post

Similar threads

Similar threads

The Market Trading Game Changer

Join 2,500+ subscribers inside the useThinkScript VIP Membership Club
  • Exclusive indicators
  • Proven strategies & setups
  • Private Discord community
  • ‘Buy The Dip’ signal alerts
  • Exclusive members-only content
  • Add-ons and resources
  • 1 full year of unlimited support

Frequently Asked Questions

What is useThinkScript?

useThinkScript is the #1 community of stock market investors using indicators and other tools to power their trading strategies. Traders of all skill levels use our forums to learn about scripting and indicators, help each other, and discover new ways to gain an edge in the markets.

How do I get started?

We get it. Our forum can be intimidating, if not overwhelming. With thousands of topics, tens of thousands of posts, our community has created an incredibly deep knowledge base for stock traders. No one can ever exhaust every resource provided on our site.

If you are new, or just looking for guidance, here are some helpful links to get you started.

What are the benefits of VIP Membership?
VIP members get exclusive access to these proven and tested premium indicators: Buy the Dip, Advanced Market Moves 2.0, Take Profit, and Volatility Trading Range. In addition, VIP members get access to over 50 VIP-only custom indicators, add-ons, and strategies, private VIP-only forums, private Discord channel to discuss trades and strategies in real-time, customer support, trade alerts, and much more. Learn all about VIP membership here.
How can I access the premium indicators?
To access the premium indicators, which are plug and play ready, sign up for VIP membership here.
Back
Top