Plot 1hr high close

shakib3585

Active member
VIP
Greetings,

I'm seeking the high and close values of the very last one-hour bar from the trading session two days ago and would like to represent them as horizontal lines on a chart. If there was a post-market session for a specific ticker symbol on that day, then that data will be included as well.

Your help is much appreciated.

Thank you.

This should work on aggregation charts less than input agg period with at least a timeframe of input daysback + 1 or more.

The image shows a 1hr bar chart in the upper pane and a 5m chart in the lower pane with the same lines for both.

Screenshot 2023-09-27 164008.png

Code:
#Plot the ending prices (high and close) of the most recent one-hour trading bar from two days ago

input daysback = 2;
input agg      = AggregationPeriod.HOUR;

#Days Defined
def ymd      = GetYYYYMMDD();
def candles  = !IsNaN(close);
def capture  = candles and ymd != ymd[1];
def dayCount = CompoundValue(1, if capture then dayCount[1] + 1 else dayCount[1], 0);
def thisDay  = (HighestAll(dayCount) - dayCount) ;

#Last Close of Agg Period Bar on Daysback
def close_agg = if IsNaN(close) then close_agg[1] else if thisDay == daysback and thisDay[-1] == daysback - 1 then close(period = agg) else close_agg[1];
#Plot Extended to Right Edge
plot lastclose_agg = close_agg;
lastclose_agg.SetPaintingStrategy(PaintingStrategy.HORIZONTAL);

#Last High of Agg Period Bar on Daysback
def high_agg = if IsNaN(close) then high_agg[1] else if thisDay == daysback and thisDay[-1] == daysback - 1 then high(period = agg) else high_agg[1];
#Plot Extended to Right Edge
plot lasthigh_agg = high_agg;
lasthigh_agg.SetPaintingStrategy(PaintingStrategy.HORIZONTAL);

input bubble      = yes;
input bubblemover = 3;
def b  = bubblemover;
def b1 = b + 1;
AddChartBubble(bubble and IsNaN(close[b]) and !IsNaN(close[b1]), lastclose_agg[b1], "LC", lastclose_agg.TakeValueColor());
AddChartBubble(bubble and IsNaN(close[b]) and !IsNaN(close[b1]), lasthigh_agg[b1], "LH", lasthigh_agg.TakeValueColor());

#
 
Last edited:

Join useThinkScript to post your question to a community of 21,000+ developers and traders.

This should work on aggregation charts less than input agg period with at least a timeframe of input daysback + 1 or more.

The image shows a 1hr bar chart in the upper pane and a 5m chart in the lower pane with the same lines for both.
One request please @SleepyZ , can this code be modified to plot the same values except now for the very first hour traded bar (including pre market) of any given day or the previous days. Thank you
 
One request please @SleepyZ , can this code be modified to plot the same values except now for the very first hour traded bar (including pre market) of any given day or the previous days. Thank you

Here is First Hour High/Close with optional moveable bubble. The bubble was also added to the Last code above.

Screenshot 2023-10-01 142942.png

Code:
#Plot the prices (high and close) of the first hour of the trading day

input daysback = 0;
input agg      = AggregationPeriod.HOUR;

#Days Defined
def ymd      = GetYYYYMMDD();
def candles  = !IsNaN(close);
def capture  = candles and ymd != ymd[1];
def dayCount = CompoundValue(1, if capture then dayCount[1] + 1 else dayCount[1], 0);
def thisDay  = (HighestAll(dayCount) - dayCount) ;

#First Close of Agg Period Bar on Daysback
def close_agg = if IsNaN(close) then close_agg[1] else if thisDay == daysback and thisDay[1] == daysback + 1 then close(period = agg) else close_agg[1];
#Plot Extended to Right Edge
plot firstclose_agg = close_agg;
firstclose_agg.SetPaintingStrategy(PaintingStrategy.HORIZONTAL);

#First High of Agg Period Bar on Daysback
def high_agg = if IsNaN(close) then high_agg[1] else if thisDay == daysback and thisDay[1] == daysback + 1 then high(period = agg) else high_agg[1];
#Plot Extended to Right Edge
plot firsthigh_agg = high_agg;
firsthigh_agg.SetPaintingStrategy(PaintingStrategy.HORIZONTAL);

input bubble      = yes;
input bubblemover = 3;
def b  = bubblemover;
def b1 = b + 1;
AddChartBubble(bubble and IsNaN(close[b]) and !IsNaN(close[b1]), firstclose_agg[b1], "FC", firstclose_agg.TakeValueColor());
AddChartBubble(bubble and IsNaN(close[b]) and !IsNaN(close[b1]), firsthigh_agg[b1], "FH", firsthigh_agg.TakeValueColor());

#
 
Last edited:
Here is First Hour High/Close with optional moveable bubble. The bubble was also added to the Last code above.

I apologize if my previous request was unclear @SleepyZ . Could you please modify this code to generate a plot for the very first hour high, close price of any given trading day, including pre-market data? Additionally, can you adapt it to calculate the first hour's high and close prices for any specified lookback period? Thank you
 
I apologize if my previous request was unclear @SleepyZ . Could you please modify this code to generate a plot for the very first hour high, close price of any given trading day, including pre-market data? Additionally, can you adapt it to calculate the first hour's high and close prices for any specified lookback period? Thank you

Sorry, I posted the wrong code above (now corrected above). I posted the modified code for your last request with the added bubble option by mistake.

Here the correct code for the first hour also.

Code:
#Plot the prices (high and close) of the first hour of the trading day

input daysback = 0;
input agg      = AggregationPeriod.HOUR;

#Days Defined
def ymd      = GetYYYYMMDD();
def candles  = !IsNaN(close);
def capture  = candles and ymd != ymd[1];
def dayCount = CompoundValue(1, if capture then dayCount[1] + 1 else dayCount[1], 0);
def thisDay  = (HighestAll(dayCount) - dayCount) ;

#First Close of Agg Period Bar on Daysback
def close_agg = if IsNaN(close) then close_agg[1] else if thisDay == daysback and thisDay[1] == daysback + 1 then close(period = agg) else close_agg[1];
#Plot Extended to Right Edge
plot firstclose_agg = close_agg;
firstclose_agg.SetPaintingStrategy(PaintingStrategy.HORIZONTAL);

#First High of Agg Period Bar on Daysback
def high_agg = if IsNaN(close) then high_agg[1] else if thisDay == daysback and thisDay[1] == daysback + 1 then high(period = agg) else high_agg[1];
#Plot Extended to Right Edge
plot firsthigh_agg = high_agg;
firsthigh_agg.SetPaintingStrategy(PaintingStrategy.HORIZONTAL);

input bubble      = yes;
input bubblemover = 3;
def b  = bubblemover;
def b1 = b + 1;
AddChartBubble(bubble and IsNaN(close[b]) and !IsNaN(close[b1]), firstclose_agg[b1], "FC", firstclose_agg.TakeValueColor());
AddChartBubble(bubble and IsNaN(close[b]) and !IsNaN(close[b1]), firsthigh_agg[b1], "FH", firsthigh_agg.TakeValueColor());

#
 
Hello,

I need to plot the line attached to the code to be extended until 20:00 without changing the values extracted. Please help

Thank you

Code:
def opentime = 1500;
def ORend = 1600;
def na = Double.NaN;
def ORActive = if GetLastDay()!= GetDay() and SecondsFromTime(opentime) >= 0 and SecondsFromTime(ORend) < 0 then 1 else 0;

def high1 = if ORActive then high(period=aggregationPeriod.HOUR) else na;
def low1 = if ORActive then low(period=aggregationperiod.hour) else na;
def close1 = if ORActive then close(period=aggregationperiod.hour) else na;
modify this script to do so.

This should work.

Screenshot 2023-10-13 173954.png
Code:
#Extend lines till post-market session

input aggperiod    = AggregationPeriod.HOUR;
input ORopentime   = 1500;
input ORendtime    = 1600;
input ORextendtime = 2000;
def na = Double.NaN;

#Find range of bars during aggperiod; Current day's OR excluded
def ORActive  = if GetLastDay() != GetDay() and
                    SecondsFromTime(ORopentime) >= 0 and SecondsFromTime(ORendtime) < 0
                then 1 else 0;
#Extended bars plot from ORActive Aggperiod that are stopped at ORendtime
def ORExtend  =  if GetLastDay() != GetDay() and
                    SecondsFromTime(ORopentime) >= 0 and SecondsFromTime(ORExtendtime) <= 0
                then 1 else 0;

#ORActive plots are Extended
def high1     = if ORActive then high(period = aggperiod) else high1[1];
def low1      = if ORActive then low(period = aggperiod) else low1[1];
def close1    = if ORActive then close(period = aggperiod) else close1[1];

#Extended ORActive plots are stopped at ORExtend time
def high1ext  = if ORExtend then high1 else na;
def low1ext   = if ORExtend then low1 else na;
def close1ext = if ORExtend then close1 else na;

plot high1_2000 = high1ext;
high1_2000.SetPaintingStrategy(PaintingStrategy.HORIZONTAL);
plot close1_2000 = close1ext;
close1_2000.SetPaintingStrategy(PaintingStrategy.HORIZONTAL);
plot low1_2000 = low1ext;
low1_2000.SetPaintingStrategy(PaintingStrategy.HORIZONTAL);
 
Last edited:
Sorry, I posted the wrong code above (now corrected above). I posted the modified code for your last request with the added bubble option by mistake.

Here the correct code for the first hour also.
Hello @SleepyZ , I'm curious if I can utilize this code to identify the highest high prices from both yesterday and two days prior. To illustrate, if today's date is 10/20/23, I'm interested in extracting the highest high price from 10/19/23 and 10/17/23. Once I have those, I'd like to also retrieve the low and close prices for the same two bars. Then plot the two pairs of highest high, low and close prices from those two days as horizontal lines. Please note that the low is not the lowest low. The data should be based on hourly aggregation and include pre- and post-market data. Thank you very much
 
Hello @SleepyZ , I'm curious if I can utilize this code to identify the highest high prices from both yesterday and two days prior. To illustrate, if today's date is 10/20/23, I'm interested in extracting the highest high price from 10/19/23 and 10/17/23. Once I have those, I'd like to also retrieve the low and close prices for the same two bars. Then plot the two pairs of highest high, low and close prices from those two days as horizontal lines. Please note that the low is not the lowest low. The data should be based on hourly aggregation and include pre- and post-market data. Thank you very much

This uses the script function to def those prices. The plots are controlled by the inputs for thisday and agg

The image shows a 15m chart with the same lines as the 1hr chartt below it.
Screenshot 2023-10-21 151449.png

Code:
#

script prior {
    input daysback = 1;
    input agg      = AggregationPeriod.HOUR;

#Days Defined
    def ymd      = GetYYYYMMDD();
    def candles  = !IsNaN(close);
    def capture  = candles and ymd != ymd[1];
    def dayCount = CompoundValue(1, if capture then dayCount[1] + 1 else dayCount[1], 0);
    def thisDay  = (HighestAll(dayCount) - dayCount) ;

#def high using hProfile
    profile vol = VolumeProfile("startNewProfile" = thisDay != thisDay[1], "onExpansion" = no, "numberOfProfiles" = 15, "pricePerRow" = .01, "value area percent" = 70);
    def hProfile = if IsNaN(vol.GetHighest()) then hProfile[1] else vol.GetHighest();

#Find High of Agg Period Bar on Daysback
    def high_agg = if thisDay == daysback then hProfile else high_agg[1];
    def high_agg_bar  = if thisDay == daysback and high(period = agg) == high_agg then BarNumber() else Double.NaN;
    plot priorhigh_agg = high_agg;
    priorhigh_agg.SetPaintingStrategy(PaintingStrategy.HORIZONTAL);

#Find close of High Agg bar
    def close_agg   = if thisDay == daysback and BarNumber() == HighestAll(high_agg_bar) then close(period = agg) else close_agg[1];
    plot priorclose_agg = close_agg;

#Find low of High Agg bar
    def low_agg   = if thisDay == daysback and BarNumber() == HighestAll(high_agg_bar) then low(period = agg) else low_agg[1];
    plot priorlow_agg = low_agg;
}

plot ph1 = prior(1);
plot pl1 = prior(1).priorlow_agg;
plot pc1 = prior(1).priorclose_agg;

ph1.SetPaintingStrategy(PaintingStrategy.HORIZONTAL);
pl1.SetPaintingStrategy(PaintingStrategy.HORIZONTAL);
pc1.SetPaintingStrategy(PaintingStrategy.HORIZONTAL);

plot ph3 = prior(3);
plot pl3 = prior(3).priorlow_agg;
plot pc3 = prior(3).priorclose_agg;

ph3.SetPaintingStrategy(PaintingStrategy.HORIZONTAL);
pl3.SetPaintingStrategy(PaintingStrategy.HORIZONTAL);
pc3.SetPaintingStrategy(PaintingStrategy.HORIZONTAL);


input bubble      = yes;
input bubblemover = 1;
def b  = bubblemover;
def b1 = b + 1;

AddChartBubble(bubble and IsNaN(close[b]) and !IsNaN(close[b1]), ph1[b1], "PH1", ph1.TakeValueColor());
AddChartBubble(bubble and IsNaN(close[b]) and !IsNaN(close[b1]), pc1[b1], "PC1", pc1.TakeValueColor());
AddChartBubble(bubble and IsNaN(close[b]) and !IsNaN(close[b1]), pl1[b1], "PL1", pl1.TakeValueColor());

AddChartBubble(bubble and IsNaN(close[b + 3]) and !IsNaN(close[b1 + 3]), ph3[b1 + 3], "PH3", ph3.TakeValueColor());
AddChartBubble(bubble and IsNaN(close[b + 3]) and !IsNaN(close[b1 + 3]), pc3[b1 + 3], "PC3", pc3.TakeValueColor());
AddChartBubble(bubble and IsNaN(close[b + 3]) and !IsNaN(close[b1 + 3]), pl3[b1 + 3], "PL3", pl3.TakeValueColor());

#
 
Last edited:
This uses the script function to def those prices. The plots are controlled by the inputs for thisday and agg

The image shows a 15m chart with the same lines as the 1hr chartt below it.
Thank you to the extreme @SleepyZ . One request, please. I intend to use this on a scanner and compare the 69 EMA and 205 EMA on those two bars. I added inside the script editor like this:
Code:
def mve = MovAvgExponential("length" = 69);
def mve1 = MovAvgExponential("length" = 205);

def a1 = if thisday ==daysback and barnumber()==highestall(high_agg_bar) then mve else mve[1];
def a2 = if thisday ==daysback and barnumber()==highestall(high_agg_bar) then mve1 else mve1[1];

later on, I plan to plot a scan such that

"plot scan = prior(1).mve>prior(1).mve1 and prior(3).mve>prior(3).mve1 ; "

Did I code it right. Please suggest
 
Figured it out @SleepyZ . Thank you so much

Code:
def ymd = GetYYYYMMDD();
def candles = !IsNaN(close);
def capture = candles and ymd != ymd[1];
def dayCount = CompoundValue(1, if capture then dayCount[1] + 1 else dayCount[1], 0);
def thisDay = (HighestAll(dayCount) - dayCount) ;
def daysback =1;

profile vol = VolumeProfile("startNewProfile" = thisDay != thisDay[1], "onExpansion" = no, "numberOfProfiles" = 5, "pricePerRow" = .01, "value area percent" = 70);
def hProfile = if IsNaN(vol.GetHighest()) then hProfile[1] else vol.GetHighest();

def high_agg1= if thisDay == daysback then hProfile else high_agg1[1];
def high_agg_bar1 = if high == high_agg1 then BarNumber() else Double.NaN;

def mve69 = MovAvgExponential("length" = 69);
def mve205 = MovAvgExponential("length" = 205);

def a1 = if thisday ==daysback and barnumber()==highestall(high_agg_bar1) then mve69 else mve69[1];
def a2 = if thisday ==daysback and barnumber()==highestall(high_agg_bar1) then mve205 else mve205[1];

plot scan = a1>a2;
I was trying with this code on the tikr MREo and realised it was not catching the low and close prices for the 3 days back where it experienced the highest high price. I have attached an image for reference. Please help @SleepyZ
 

Attachments

  • capture.jpg
    capture.jpg
    174.9 KB · Views: 140
I was trying with this code on the tikr MREo and realised it was not catching the low and close prices for the 3 days back where it experienced the highest high price. I have attached an image for reference. Please help @SleepyZ

Thank you for letting me know. This def needed the following fix to specify which day to use

def high_agg_bar = if thisday == daysback and high(period=agg) == high_agg then barnumber() else double.nan;

The following code and that in the original post have been modified with this fix.

Screenshot 2023-10-22 233126.png
Code:
#

script prior {
    input daysback = 1;
    input agg      = AggregationPeriod.HOUR;

#Days Defined
    def ymd      = GetYYYYMMDD();
    def candles  = !IsNaN(close);
    def capture  = candles and ymd != ymd[1];
    def dayCount = CompoundValue(1, if capture then dayCount[1] + 1 else dayCount[1], 0);
    def thisDay  = (HighestAll(dayCount) - dayCount) ;

#def high using hProfile
    profile vol = VolumeProfile("startNewProfile" = thisDay != thisDay[1], "onExpansion" = no, "numberOfProfiles" = 15, "pricePerRow" = .01, "value area percent" = 70);
    def hProfile = if IsNaN(vol.GetHighest()) then hProfile[1] else vol.GetHighest();

#Find High of Agg Period Bar on Daysback
    def high_agg = if thisDay == daysback then hProfile else high_agg[1];
    def high_agg_bar  = if thisDay == daysback and high(period = agg) == high_agg then BarNumber() else Double.NaN;
    plot priorhigh_agg = high_agg;
    priorhigh_agg.SetPaintingStrategy(PaintingStrategy.HORIZONTAL);

#Find close of High Agg bar
    def close_agg   = if thisDay == daysback and BarNumber() == HighestAll(high_agg_bar) then close(period = agg) else close_agg[1];
    plot priorclose_agg = close_agg;

#Find low of High Agg bar
    def low_agg   = if thisDay == daysback and BarNumber() == HighestAll(high_agg_bar) then low(period = agg) else low_agg[1];
    plot priorlow_agg = low_agg;
}

plot ph1 = prior(1);
plot pl1 = prior(1).priorlow_agg;
plot pc1 = prior(1).priorclose_agg;

ph1.SetPaintingStrategy(PaintingStrategy.HORIZONTAL);
pl1.SetPaintingStrategy(PaintingStrategy.HORIZONTAL);
pc1.SetPaintingStrategy(PaintingStrategy.HORIZONTAL);

plot ph3 = prior(3);
plot pl3 = prior(3).priorlow_agg;
plot pc3 = prior(3).priorclose_agg;

ph3.SetPaintingStrategy(PaintingStrategy.HORIZONTAL);
pl3.SetPaintingStrategy(PaintingStrategy.HORIZONTAL);
pc3.SetPaintingStrategy(PaintingStrategy.HORIZONTAL);


input bubble      = yes;
input bubblemover = 1;
def b  = bubblemover;
def b1 = b + 1;

AddChartBubble(bubble and IsNaN(close[b]) and !IsNaN(close[b1]), ph1[b1], "PH1", ph1.TakeValueColor());
AddChartBubble(bubble and IsNaN(close[b]) and !IsNaN(close[b1]), pc1[b1], "PC1", pc1.TakeValueColor());
AddChartBubble(bubble and IsNaN(close[b]) and !IsNaN(close[b1]), pl1[b1], "PL1", pl1.TakeValueColor());

AddChartBubble(bubble and IsNaN(close[b + 3]) and !IsNaN(close[b1 + 3]), ph3[b1 + 3], "PH3", ph3.TakeValueColor());
AddChartBubble(bubble and IsNaN(close[b + 3]) and !IsNaN(close[b1 + 3]), pc3[b1 + 3], "PC3", pc3.TakeValueColor());
AddChartBubble(bubble and IsNaN(close[b + 3]) and !IsNaN(close[b1 + 3]), pl3[b1 + 3], "PL3", pl3.TakeValueColor());

#
 
Hello,

I need to plot the line attached to the code to be extended until 20:00 without changing the values extracted. Please help

Thank you

Code:
def opentime = 1500;
def ORend = 1600;
def na = Double.NaN;
def ORActive = if GetLastDay()!= GetDay() and SecondsFromTime(opentime) >= 0 and SecondsFromTime(ORend) < 0 then 1 else 0;

def high1 = if ORActive then high(period=aggregationPeriod.HOUR) else na;
def low1 = if ORActive then low(period=aggregationperiod.hour) else na;
def close1 = if ORActive then close(period=aggregationperiod.hour) else na;
modify this script to do so.
 

Attachments

  • ERROR.png
    ERROR.png
    113.7 KB · Views: 111
  • ERROR.png
    ERROR.png
    113.7 KB · Views: 106
Thank you for letting me know. This def needed the following fix to specify which day to use

def high_agg_bar = if thisday == daysback and high(period=agg) == high_agg then barnumber() else double.nan;

The following code and that in the original post have been modified with this fix.
Hello @SleepyZ , Can you please help to modify this code so that it plots the highest high and lowest low from the previous day on the current day at any aggregation? Additionally, I'd like the code to plot the highest high and lowest low for all the previous days, each corresponding to their respective previous days.
 
Hello @SleepyZ , Can you please help to modify this code so that it plots the highest high and lowest low from the previous day on the current day at any aggregation? Additionally, I'd like the code to plot the highest high and lowest low for all the previous days, each corresponding to their respective previous days.

This provides an option to only display the lines on the current day for the prior day's highs/lows.

There are 3 prior day's included in the code. More day's can be created using the logic for the 3 days and changing the values for each day.

The image shows in the upper chart the showtodayonly option and below is without this option.

Screenshot 2023-10-28 095921.png
Code:
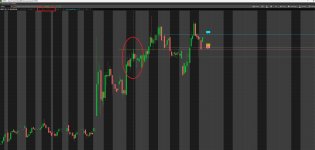
#Previous Day's Highs/Lows extended to the right edge
input showtodayonly = yes;
def na = Double.NaN;

script prior {
    input daysback = 1;
    input agg      = AggregationPeriod.HOUR;

#Days Defined
    def ymd      = GetYYYYMMDD();
    def candles  = !IsNaN(close);
    def capture  = candles and ymd != ymd[1];
    def dayCount = CompoundValue(1, if capture then dayCount[1] + 1 else dayCount[1], 0);
    def thisDay  = (HighestAll(dayCount) - dayCount) ;

#def high using hProfile
    profile vol = VolumeProfile("startNewProfile" = thisDay != thisDay[1], "onExpansion" = no, "numberOfProfiles" = 15, "pricePerRow" = .01, "value area percent" = 70);
    def hProfile = if IsNaN(vol.GetHighest()) then hProfile[1] else vol.GetHighest();

#Find High of Agg Period Bar on Daysback
    def high_agg = if thisDay == daysback then hProfile else high_agg[1];
    def high_agg_bar  = if thisDay == daysback and high(period = agg) == high_agg then BarNumber() else Double.NaN;
    plot priorhigh_agg = high_agg;
    priorhigh_agg.SetPaintingStrategy(PaintingStrategy.HORIZONTAL);

#Find low of Agg Period Bar on Daysback
#def high using hProfile

    def lProfile = if IsNaN(vol.GetLowest()) then lProfile[1] else vol.GetLowest();

#Find Low of Agg Period Bar on Daysback
    def low_agg = if thisDay == daysback then lProfile else low_agg[1];
    def low_agg_bar  = if thisDay == daysback and low(period = agg) == high_agg then BarNumber() else Double.NaN;
    plot priorlow_agg = low_agg;
    priorlow_agg.SetPaintingStrategy(PaintingStrategy.HORIZONTAL);
}


plot ph1 = if showtodayonly and GetDay() != GetLastDay() then na else prior(1);
plot pl1 = if showtodayonly and GetDay() != GetLastDay() then na else prior(1).priorlow_agg;

ph1.SetPaintingStrategy(PaintingStrategy.HORIZONTAL);
pl1.SetPaintingStrategy(PaintingStrategy.HORIZONTAL);

plot ph2 = if showtodayonly and GetDay() != GetLastDay() then na else prior(2);
plot pl2 = if showtodayonly and GetDay() != GetLastDay() then na else prior(2).priorlow_agg;

ph2.SetPaintingStrategy(PaintingStrategy.HORIZONTAL);
pl2.SetPaintingStrategy(PaintingStrategy.HORIZONTAL);

plot ph3 = if showtodayonly and GetDay() != GetLastDay() then na else prior(3);
plot pl3 = if showtodayonly and GetDay() != GetLastDay() then na else prior(3).priorlow_agg;

ph3.SetPaintingStrategy(PaintingStrategy.HORIZONTAL);
pl3.SetPaintingStrategy(PaintingStrategy.HORIZONTAL);

DefineGlobalColor("H", Color.CYAN);
DefineGlobalColor("L", Color.MAGENTA);

ph1.SetDefaultColor(GlobalColor("H"));
ph2.SetDefaultColor(GlobalColor("H"));
ph3.SetDefaultColor(GlobalColor("H"));

pl1.SetDefaultColor(GlobalColor("L"));
pl2.SetDefaultColor(GlobalColor("L"));
pl3.SetDefaultColor(GlobalColor("L"));


input bubble      = yes;
input bubblemover = 1;
def b  = bubblemover;
def b1 = b + 1;

AddChartBubble(bubble and IsNaN(close[b]) and !IsNaN(close[b1]), ph1[b1], "PH1", ph1.TakeValueColor());
AddChartBubble(bubble and IsNaN(close[b]) and !IsNaN(close[b1]), pl1[b1], "PL1", pl1.TakeValueColor(), no);
AddChartBubble(bubble and IsNaN(close[b]) and !IsNaN(close[b1]), ph2[b1], "PH2", ph2.TakeValueColor());
AddChartBubble(bubble and IsNaN(close[b]) and !IsNaN(close[b1]), pl2[b1], "PL2", pl2.TakeValueColor(), no);
AddChartBubble(bubble and IsNaN(close[b]) and !IsNaN(close[b1]), ph3[b1], "PH3", ph3.TakeValueColor());
AddChartBubble(bubble and IsNaN(close[b]) and !IsNaN(close[b1]), pl3[b1], "PL3", pl3.TakeValueColor(), no);

#
 

Similar threads

Not the exact question you're looking for?

Start a new thread and receive assistance from our community.

87k+ Posts
344 Online
Create Post

Similar threads

Similar threads

The Market Trading Game Changer

Join 2,500+ subscribers inside the useThinkScript VIP Membership Club
  • Exclusive indicators
  • Proven strategies & setups
  • Private Discord community
  • ‘Buy The Dip’ signal alerts
  • Exclusive members-only content
  • Add-ons and resources
  • 1 full year of unlimited support

Frequently Asked Questions

What is useThinkScript?

useThinkScript is the #1 community of stock market investors using indicators and other tools to power their trading strategies. Traders of all skill levels use our forums to learn about scripting and indicators, help each other, and discover new ways to gain an edge in the markets.

How do I get started?

We get it. Our forum can be intimidating, if not overwhelming. With thousands of topics, tens of thousands of posts, our community has created an incredibly deep knowledge base for stock traders. No one can ever exhaust every resource provided on our site.

If you are new, or just looking for guidance, here are some helpful links to get you started.

What are the benefits of VIP Membership?
VIP members get exclusive access to these proven and tested premium indicators: Buy the Dip, Advanced Market Moves 2.0, Take Profit, and Volatility Trading Range. In addition, VIP members get access to over 50 VIP-only custom indicators, add-ons, and strategies, private VIP-only forums, private Discord channel to discuss trades and strategies in real-time, customer support, trade alerts, and much more. Learn all about VIP membership here.
How can I access the premium indicators?
To access the premium indicators, which are plug and play ready, sign up for VIP membership here.
Back
Top