here is the volume script from skygen's setup above.
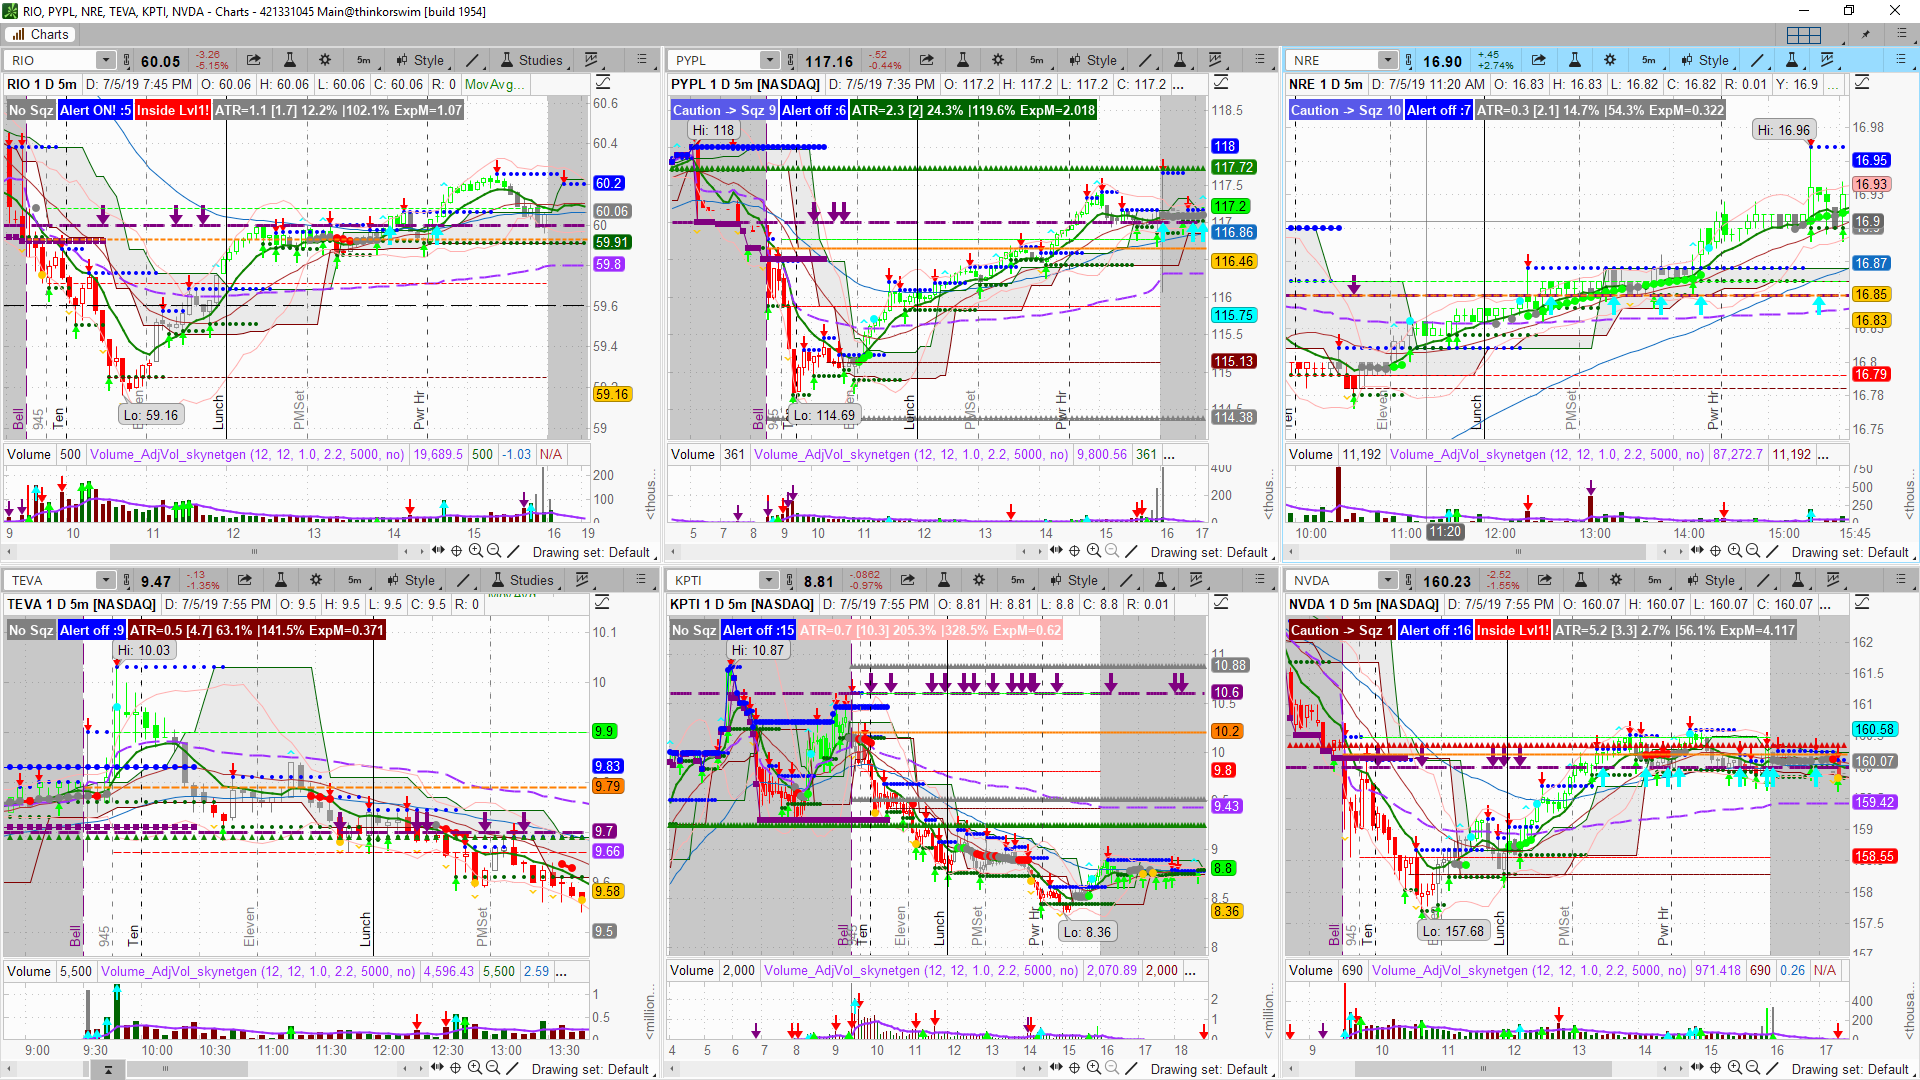
I'm looking for a volume alert, when Green or Cyan arrows appear on green volume. Thank you so much in advance!
#adjusted volume for intradayFlagFormation . ignoring first and last bar spikes
#integrated RelativeVolumeStdDev
#integrated volavg
declare on_volume;
declare zerobase;
input avglength = 12;
input RelVolLength = 12; #12 for intraday, 20 for daily
input numDev = 1.0;
input ExtranumDev = 2.3;
input MegaDev=4;
input VolWarning = 10000;
input displayVolume=no;
#
def pastOpen = If((SecondsTillTime(0830) > 0), 0, 1);
def pastClose = If((SecondsTillTime(01500) > 0), 0, 1);
def marketOpen = If(pastOpen and !pastClose, 1, 0);
# first and last bar volumes should be ignored in intraday
def aggIntraday = GetAggregationPeriod() <= AggregationPeriod.FIVE_MIN;
def firstbars = if aggIntraday and SecondsFromTime(0930) >= 0 and SecondsTillTime(0935) > 0 then 1 else 0;
def lastbars = if aggIntraday and SecondsFromTime(1550) >= 0 and SecondsTillTime(1605) > 0 then 1 else 0;
def avgvolume = expAverage(volume, avglength);
def adjvol = if firstbars then volume/5 else if lastbars then avgvolume[2] else volume;
#volavg
plot adjvolAvg = expAverage(adjvol, avglength);
adjvolAvg.SetLineWeight(2);
adjvolAvg.SetDefaultColor(GetColor(8));
#because it colors like candles colored by default (and trendskynetgen colors differently)
#I reset here cause I only want green/red colors
def SellPressure = close < open ;
plot VolColor = adjvol;
VolColor.SetPaintingStrategy(PaintingStrategy.HISTOGRAM); volcolor.setLineWeight(5);
VolColor.AssignValueColor(if SellPressure then Color.DARK_RED else Color.DARK_GREEN);
#RelVol
def rawRelVol = (adjvol - Average(adjvol , RelVollength)) / StDev(adjvol , RelVollength);
def RelVol = rawRelVol;
#def StDevLevel = numDev;
#just to see in title relvol and volume
plot pDisplayRelVol=Round(RawRelvol,2);
plot vol=volume; vol.SetPaintingStrategy(paintingStrategy.HISTOGRAM);
vol.setDefaultColor(GetColor(3));
vol.SetHiding(!displayVolume);
#closing - mid range mhe. upper 0.75 - bull, lower 0.75 bear
def range = AbsValue(high - low);
def relclose = close-low;
def closeBull = relclose >= (0.62* range);
def closeBear = relclose < (0.32 * range);
#
def RelVolSignal= if Relvol>MEgaDev then 4
else if Relvol>extranumDev then 3
else if RelVol>NumDev then 2
else if adjvol>adjvolAvg then 1
else if Relvol<-1.3 then -1.3
else 0;
plot pRelVolUP = if RelVolSignal>1 and !closebear then adjvol else Double.NaN;
pRelVolUP.SetPaintingStrategy(PaintingStrategy.ARROW_UP);
pRelVolUP.SetLineWeight(2);
pRelVolUP.AssignValueColor(
if relvolSignal==4 then color.yeLLOW
else if relvolsignal==3 then Color.cyan
else color.green);
prelvolup.hideTitle();
#
plot pRelVolDn = if RelVolSignal>1 and closeBear then adjvol*0.9 else Double.NaN;
pRelVolDn.SetPaintingStrategy(PaintingStrategy.ARROW_DOWN);
pRelVolDN.SetLineWeight(2);
pRelVolDN.AssignValueColor(
if relvolSignal==4 then color.VIOLET
else if relvolsignal==3 then Color.Dark_orange
else color.red);
prelvoldn.hideTitle();
plot pRelVolMin= if relvolSignal<0 then adjvol else double.nan;
prelvolMin.setPaintingStrategy(PaintingStrategy.BOOLEAN_WEDGE_UP); prelVolMin.setLineWeight(3);
prelvolmin.setdefaultColor(Color.VIOLET);prelvolmin.hideTitle();
#warning
#AddLabel(marketOpen and avgvolume < VolWarning, "Low Average Volume!" );
-----------------------------------

")
