PivotAlert - catch the setups

skynetgen

Well-known member
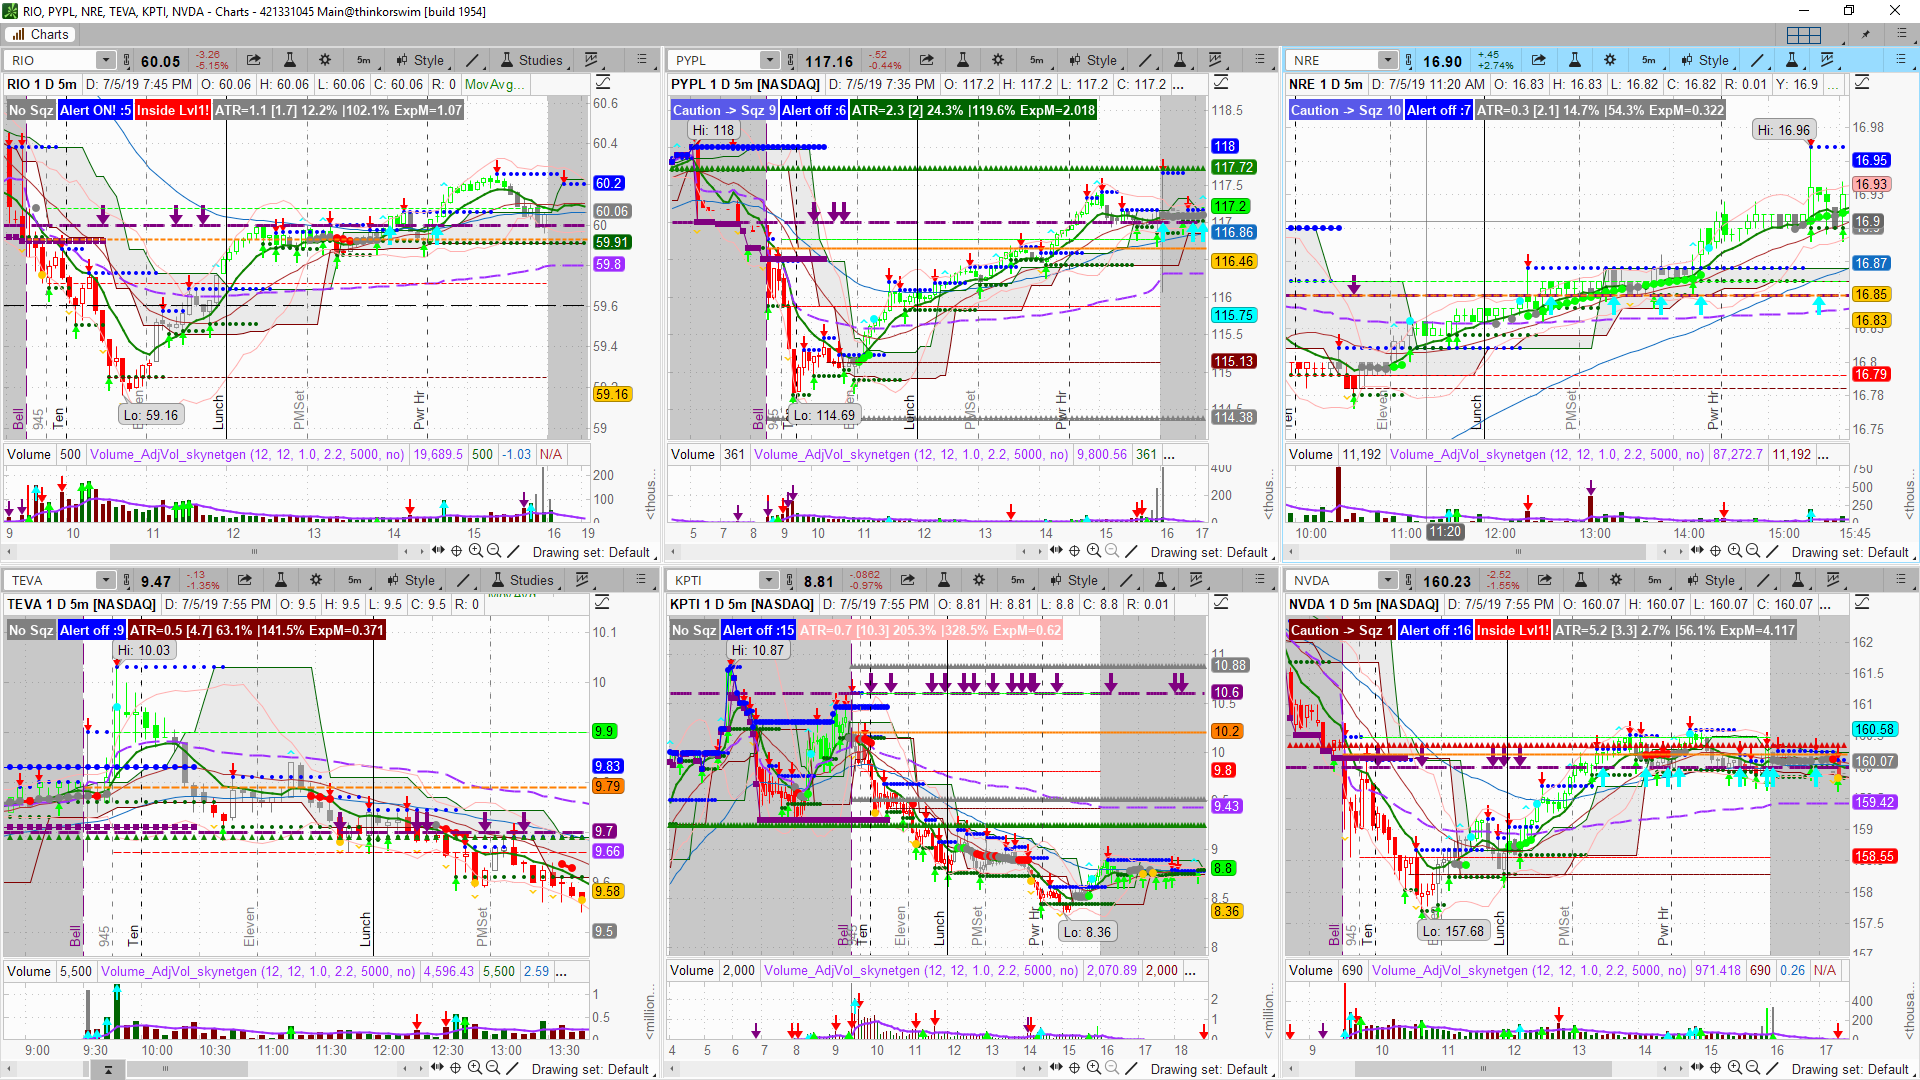
One of the biggest problems for me is tracking the proper entry for the setup intraday. Market moves, there are too many tickers too watch, too many things to take care of. So I made this simple upper chart indicator: add it to chart, setup the line under/over the setup is valid and take care of other thing. Once the setup happens (vwap and pivot condition) you will get alert and audible ring.
https://tos.mx/bXH5MT
eB9tDfW.png


The thick purple line is the pivot line you set yourself. And big arrows are when the alert is generated
 

Join useThinkScript to post your question to a community of 21,000+ developers and traders.

Hey, thanks for sharing your setup. I'm pretty interested in trying this out, but it seems that it doesnt work in afterhours/non-trading hours? I tried changing the start time to 9:30 since that's market open for me, but I don't see the pivot line?

I also see the alert as a chart label but no lines or signals painted. I'm currently using a 5 minute chart if that helps. In addition, on some tickers I see a number after the Alert (chart label), not sure what that means.. Any help and information would be appreciated :)
 
Last edited:
Hey, thanks for sharing your setup. I'm pretty interested in trying this out, but it seems that it doesnt work in afterhours/non-trading hours? I tried changing the start time to 9:30 since that's market open for me, but I don't see the pivot line?

I also see the alert as a chart label but no lines or signals painted. I'm currently using a 5 minute chart if that helps. In addition, on some tickers I see a number after the Alert (chart label), not sure what that means.. Any help and information would be appreciated :)

The number is how many times alert was fired.

Yeah its only for intraday trading. You have to adjust pivot line in setting for each stock . For example my KPTI pivot point was 10.6 which I setup premarket . If it clears it - it would be good long if stays under - good short (its also takes into account vwp)- signal itself is generated when vwap, pivot line, time (you can setup when alert is active - I dont trade first 15-30 minutes) and price pivot are in accord
It just alert mechanism to help you follow up with the thesis. This indicator does not make thesis by itself

p.s. Also you can turn on/off in settings it when signal is no longer necessary (otherwise ringing can get quite annoying)
 
Last edited:
here is the volume script from skygen's setup above.
I'm looking for a volume alert, when Green or Cyan arrows appear on green volume. Thank you so much in advance!

#adjusted volume for intradayFlagFormation . ignoring first and last bar spikes
#integrated RelativeVolumeStdDev
#integrated volavg

declare on_volume;
declare zerobase;
input avglength = 12;
input RelVolLength = 12; #12 for intraday, 20 for daily
input numDev = 1.0;
input ExtranumDev = 2.3;
input MegaDev=4;
input VolWarning = 10000;
input displayVolume=no;

#
def pastOpen = If((SecondsTillTime(0830) > 0), 0, 1);
def pastClose = If((SecondsTillTime(01500) > 0), 0, 1);
def marketOpen = If(pastOpen and !pastClose, 1, 0);

# first and last bar volumes should be ignored in intraday
def aggIntraday = GetAggregationPeriod() <= AggregationPeriod.FIVE_MIN;
def firstbars = if aggIntraday and SecondsFromTime(0930) >= 0 and SecondsTillTime(0935) > 0 then 1 else 0;
def lastbars = if aggIntraday and SecondsFromTime(1550) >= 0 and SecondsTillTime(1605) > 0 then 1 else 0;

def avgvolume = expAverage(volume, avglength);
def adjvol = if firstbars then volume/5 else if lastbars then avgvolume[2] else volume;

#volavg
plot adjvolAvg = expAverage(adjvol, avglength);
adjvolAvg.SetLineWeight(2);
adjvolAvg.SetDefaultColor(GetColor(8));

#because it colors like candles colored by default (and trendskynetgen colors differently)
#I reset here cause I only want green/red colors

def SellPressure = close < open ;
plot VolColor = adjvol;
VolColor.SetPaintingStrategy(PaintingStrategy.HISTOGRAM); volcolor.setLineWeight(5);
VolColor.AssignValueColor(if SellPressure then Color.DARK_RED else Color.DARK_GREEN);


#RelVol
def rawRelVol = (adjvol - Average(adjvol , RelVollength)) / StDev(adjvol , RelVollength);
def RelVol = rawRelVol;
#def StDevLevel = numDev;
#just to see in title relvol and volume
plot pDisplayRelVol=Round(RawRelvol,2);
plot vol=volume; vol.SetPaintingStrategy(paintingStrategy.HISTOGRAM);
vol.setDefaultColor(GetColor(3));
vol.SetHiding(!displayVolume);

#closing - mid range mhe. upper 0.75 - bull, lower 0.75 bear
def range = AbsValue(high - low);
def relclose = close-low;
def closeBull = relclose >= (0.62* range);
def closeBear = relclose < (0.32 * range);
#
def RelVolSignal= if Relvol>MEgaDev then 4
else if Relvol>extranumDev then 3
else if RelVol>NumDev then 2
else if adjvol>adjvolAvg then 1
else if Relvol<-1.3 then -1.3
else 0;
plot pRelVolUP = if RelVolSignal>1 and !closebear then adjvol else Double.NaN;
pRelVolUP.SetPaintingStrategy(PaintingStrategy.ARROW_UP);
pRelVolUP.SetLineWeight(2);
pRelVolUP.AssignValueColor(
if relvolSignal==4 then color.yeLLOW
else if relvolsignal==3 then Color.cyan
else color.green);
prelvolup.hideTitle();
#
plot pRelVolDn = if RelVolSignal>1 and closeBear then adjvol*0.9 else Double.NaN;
pRelVolDn.SetPaintingStrategy(PaintingStrategy.ARROW_DOWN);
pRelVolDN.SetLineWeight(2);
pRelVolDN.AssignValueColor(
if relvolSignal==4 then color.VIOLET
else if relvolsignal==3 then Color.Dark_orange
else color.red);
prelvoldn.hideTitle();

plot pRelVolMin= if relvolSignal<0 then adjvol else double.nan;
prelvolMin.setPaintingStrategy(PaintingStrategy.BOOLEAN_WEDGE_UP); prelVolMin.setLineWeight(3);
prelvolmin.setdefaultColor(Color.VIOLET);prelvolmin.hideTitle();

#warning
#AddLabel(marketOpen and avgvolume < VolWarning, "Low Average Volume!" );

-----------------------------------
 
Last edited by a moderator:
here is the volume script from skygen's setup above.
I'm looking for a volume alert, when Green or Cyan arrows appear on green volume. Thank you so much in advance!

#adjusted volume for intradayFlagFormation . ignoring first and last bar spikes
#integrated RelativeVolumeStdDev
#integrated volavg

declare on_volume;
declare zerobase;
input avglength = 12;
input RelVolLength = 12; #12 for intraday, 20 for daily
input numDev = 1.0;
input ExtranumDev = 2.3;
input MegaDev=4;
input VolWarning = 10000;
input displayVolume=no;

#
def pastOpen = If((SecondsTillTime(0830) > 0), 0, 1);
def pastClose = If((SecondsTillTime(01500) > 0), 0, 1);
def marketOpen = If(pastOpen and !pastClose, 1, 0);

# first and last bar volumes should be ignored in intraday
def aggIntraday = GetAggregationPeriod() <= AggregationPeriod.FIVE_MIN;
def firstbars = if aggIntraday and SecondsFromTime(0930) >= 0 and SecondsTillTime(0935) > 0 then 1 else 0;
def lastbars = if aggIntraday and SecondsFromTime(1550) >= 0 and SecondsTillTime(1605) > 0 then 1 else 0;

def avgvolume = expAverage(volume, avglength);
def adjvol = if firstbars then volume/5 else if lastbars then avgvolume[2] else volume;

#volavg
plot adjvolAvg = expAverage(adjvol, avglength);
adjvolAvg.SetLineWeight(2);
adjvolAvg.SetDefaultColor(GetColor(8));

#because it colors like candles colored by default (and trendskynetgen colors differently)
#I reset here cause I only want green/red colors

def SellPressure = close < open ;
plot VolColor = adjvol;
VolColor.SetPaintingStrategy(PaintingStrategy.HISTOGRAM); volcolor.setLineWeight(5);
VolColor.AssignValueColor(if SellPressure then Color.DARK_RED else Color.DARK_GREEN);


#RelVol
def rawRelVol = (adjvol - Average(adjvol , RelVollength)) / StDev(adjvol , RelVollength);
def RelVol = rawRelVol;
#def StDevLevel = numDev;
#just to see in title relvol and volume
plot pDisplayRelVol=Round(RawRelvol,2);
plot vol=volume; vol.SetPaintingStrategy(paintingStrategy.HISTOGRAM);
vol.setDefaultColor(GetColor(3));
vol.SetHiding(!displayVolume);

#closing - mid range mhe. upper 0.75 - bull, lower 0.75 bear
def range = AbsValue(high - low);
def relclose = close-low;
def closeBull = relclose >= (0.62* range);
def closeBear = relclose < (0.32 * range);
#
def RelVolSignal= if Relvol>MEgaDev then 4
else if Relvol>extranumDev then 3
else if RelVol>NumDev then 2
else if adjvol>adjvolAvg then 1
else if Relvol<-1.3 then -1.3
else 0;
plot pRelVolUP = if RelVolSignal>1 and !closebear then adjvol else Double.NaN;
pRelVolUP.SetPaintingStrategy(PaintingStrategy.ARROW_UP);
pRelVolUP.SetLineWeight(2);
pRelVolUP.AssignValueColor(
if relvolSignal==4 then color.yeLLOW
else if relvolsignal==3 then Color.cyan
else color.green);
prelvolup.hideTitle();
#
plot pRelVolDn = if RelVolSignal>1 and closeBear then adjvol*0.9 else Double.NaN;
pRelVolDn.SetPaintingStrategy(PaintingStrategy.ARROW_DOWN);
pRelVolDN.SetLineWeight(2);
pRelVolDN.AssignValueColor(
if relvolSignal==4 then color.VIOLET
else if relvolsignal==3 then Color.Dark_orange
else color.red);
prelvoldn.hideTitle();

plot pRelVolMin= if relvolSignal<0 then adjvol else double.nan;
prelvolMin.setPaintingStrategy(PaintingStrategy.BOOLEAN_WEDGE_UP); prelVolMin.setLineWeight(3);
prelvolmin.setdefaultColor(Color.VIOLET);prelvolmin.hideTitle();

#warning
#AddLabel(marketOpen and avgvolume < VolWarning, "Low Average Volume!" );

-----------------------------------
Add to bottom of your script:
Alert(open>close and relvolSignal !=4, "cyan or green arrow", Alert.Bar, Sound.ding);
 
Is there a way to get arrows that appear on volume candles to appear on the candle chart as well. For example if we get cyan arrow on volume I would like to get that cyan arrow on the chart candle itself and if we get a down red arrow, the same to appear on the candle chart on to of the candle. Thanks in advance.
 
Is there a way to get arrows that appear on volume candles to appear on the candle chart as well. For example if we get cyan arrow on volume I would like to get that cyan arrow on the chart candle itself and if we get a down red arrow, the same to appear on the candle chart on to of the candle. Thanks in advance.

volume spike arrows for the upper chart:
SyTPNsl.png


Ruby:
# UPPER CHART ONLY
#adjusted volume for intradayFlagFormation . ignoring first and last bar spikes
#integrated RelativeVolumeStdDev
#integrated volavg

input avglength = 12;
input RelVolLength = 12; #12 for intraday, 20 for daily
input numDev = 1.0;
input ExtranumDev = 2.3;
input MegaDev=4;
input VolWarning = 10000;
input displayVolume=no;

#
def pastOpen = If((SecondsTillTime(0830) > 0), 0, 1);
def pastClose = If((SecondsTillTime(01500) > 0), 0, 1);
def marketOpen = If(pastOpen and !pastClose, 1, 0);

# first and last bar volumes should be ignored in intraday
def aggIntraday = GetAggregationPeriod() <= AggregationPeriod.FIVE_MIN;
def firstbars = if aggIntraday and SecondsFromTime(0930) >= 0 and SecondsTillTime(0935) > 0 then 1 else 0;
def lastbars = if aggIntraday and SecondsFromTime(1550) >= 0 and SecondsTillTime(1605) > 0 then 1 else 0;

def avgvolume = expAverage(volume, avglength);
def adjvol = if firstbars then volume/5 else if lastbars then avgvolume[2] else volume;

#volavg
def adjvolAvg = expAverage(adjvol, avglength);


#because it colors like candles colored by default (and trendskynetgen colors differently)
#I reset here cause I only want green/red colors

def SellPressure = close < open ;
#plot VolColor = adjvol;
#VolColor.SetPaintingStrategy(PaintingStrategy.HISTOGRAM); volcolor.setLineWeight(5);
#VolColor.AssignValueColor(if SellPressure then Color.DARK_RED else Color.DARK_GREEN);


#RelVol
def rawRelVol = (adjvol - Average(adjvol , RelVollength)) / StDev(adjvol , RelVollength);
def RelVol = rawRelVol;
#def StDevLevel = numDev;
#just to see in title relvol and volume
def pDisplayRelVol=Round(RawRelvol,2);
#plot vol=volume; vol.SetPaintingStrategy(paintingStrategy.HISTOGRAM);
#vol.setDefaultColor(GetColor(3));
#vol.SetHiding(!displayVolume);

#closing - mid range mhe. upper 0.75 - bull, lower 0.75 bear
def range = AbsValue(high - low);
def relclose = close-low;
def closeBull = relclose >= (0.62* range);
def closeBear = relclose < (0.32 * range);
#
def RelVolSignal= if Relvol>MEgaDev then 4
else if Relvol>extranumDev then 3
else if RelVol>NumDev then 2
else if adjvol>adjvolAvg then 1
else if Relvol<-1.3 then -1.3
else 0;


plot pRelVolUP = if RelVolSignal>1 and !closebear then low else Double.NaN;
pRelVolUP.SetPaintingStrategy(PaintingStrategy.BOOLEAN_ARROW_UP);
pRelVolUP.SetLineWeight(2);
pRelVolUP.AssignValueColor(
if relvolSignal==4 then color.yeLLOW
else if relvolsignal==3 then Color.cyan
else color.green);
prelvolup.hideTitle();
#
plot pRelVolDn = if RelVolSignal>1 and closeBear then high else Double.NaN;
pRelVolDn.SetPaintingStrategy(PaintingStrategy.BOOLEAN_ARROW_DOWN);
pRelVolDN.SetLineWeight(2);
pRelVolDN.AssignValueColor(
if relvolSignal==4 then color.VIOLET
else if relvolsignal==3 then Color.Dark_orange
else color.red);
prelvoldn.hideTitle();

plot pRelVolMin= if relvolSignal<0 then low else double.nan;
prelvolMin.setPaintingStrategy(PaintingStrategy.BOOLEAN_WEDGE_UP); prelVolMin.setLineWeight(3);
prelvolmin.setdefaultColor(Color.VIOLET);prelvolmin.hideTitle();

#warning
#AddLabel(marketOpen and avgvolume < VolWarning, "Low Average Volume!" );
 
One of the biggest problems for me is tracking the proper entry for the setup intraday. Market moves, there are too many tickers too watch, too many things to take care of. So I made this simple upper chart indicator: add it to chart, setup the line under/over the setup is valid and take care of other thing. Once the setup happens (vwap and pivot condition) you will get alert and audible ring.
https://tos.mx/bXH5MT
eB9tDfW.png


The thick purple line is the pivot line you set yourself. And big arrows are when the alert is generated
Hi, I'm very new can't make my chart look anything like yours after copying your posted script (https://tos.mx/bXH5MT) into TOS. A suggestion on how to accomplish this would be very helpful, Thanks Very Much, SriAndy
 
Hi, I'm very new can't make my chart look anything like yours after copying your posted script (https://tos.mx/bXH5MT) into TOS. A suggestion on how to accomplish this would be very helpful, Thanks Very Much, SriAndy
Did you know that by clicking on a member's name, you can easily check when they were last seen on the uTS forum? It's a great way to keep track of who's been around recently, and who hasn't. Speaking of which, it looks like @skynetgen is no longer active. :(
 

Not the exact question you're looking for?

Start a new thread and receive assistance from our community.

87k+ Posts
434 Online
Create Post

The Market Trading Game Changer

Join 2,500+ subscribers inside the useThinkScript VIP Membership Club
  • Exclusive indicators
  • Proven strategies & setups
  • Private Discord community
  • ‘Buy The Dip’ signal alerts
  • Exclusive members-only content
  • Add-ons and resources
  • 1 full year of unlimited support

Frequently Asked Questions

What is useThinkScript?

useThinkScript is the #1 community of stock market investors using indicators and other tools to power their trading strategies. Traders of all skill levels use our forums to learn about scripting and indicators, help each other, and discover new ways to gain an edge in the markets.

How do I get started?

We get it. Our forum can be intimidating, if not overwhelming. With thousands of topics, tens of thousands of posts, our community has created an incredibly deep knowledge base for stock traders. No one can ever exhaust every resource provided on our site.

If you are new, or just looking for guidance, here are some helpful links to get you started.

What are the benefits of VIP Membership?
VIP members get exclusive access to these proven and tested premium indicators: Buy the Dip, Advanced Market Moves 2.0, Take Profit, and Volatility Trading Range. In addition, VIP members get access to over 50 VIP-only custom indicators, add-ons, and strategies, private VIP-only forums, private Discord channel to discuss trades and strategies in real-time, customer support, trade alerts, and much more. Learn all about VIP membership here.
How can I access the premium indicators?
To access the premium indicators, which are plug and play ready, sign up for VIP membership here.
Back
Top