#PGO Indicator
#Ported from TC2000 Code from Richard Moglen
#https://www.youtube.com/watch?v=_XNwgIQEhe4
#
#The PGO Indicator is a combination of my Purple and Orange Dot indicators and
#Dr. Wish's Green Dot Indicator.
#It represents a stock moving out of consolidation on volume.
#It provides an excellent entry point for swing and #momentum trades in growth stocks.
#
#
#Ported from TC2000 and Tradeview Source
# 2019.10.12 - diazlaz - Initial Port +
# - Integrated the Ergodic Indicator
declare upper;
input longLength = 25;
input shortLength = 13;
input signalLength = 8;
input averageType = AverageType.Exponential;
input period = 10;
input KPeriod = 4;
input colorPGO = yes;
input colorErgodic = no;
#Ergodic Indicator
def ErgodiIndicator = TrueStrengthIndex(longLength, shortLength, signalLength, averageType).TSI - TrueStrengthIndex(longLength, shortLength, signalLength, averageType).Signal;
# Green Dot Indicator
def lowest_k = Lowest(low, KPeriod);
def c1 = close - lowest_k;
def c2 = Highest(high, KPeriod) - lowest_k;
def FastK = if c2 != 0 then c1 / c2 * 100 else 0;
def stoc = MovingAverage(AverageType.SIMPLE, FastK, period);
def isGreenDot = stoc[1] / average(stoc[1],4) < 1 and stoc[1] < 60 and stoc / average(stoc,4) > 1;
# Purple Dot Indicator
def isPurpleDot = ( (ExpAverage(close, 2) / ExpAverage(close, 8) > 1) and
(ExpAverage(close, 3) / ExpAverage(close, 5) < 1.5) and
(ExpAverage(close, 4) / ExpAverage(close, 8) > .7) and
(ExpAverage(close, 5) / ExpAverage(close, 30) > .95) ) and
close > close[1] and close > close[2] and close > close[3];
# Orange Dot Indicator
def MACD = MovingAverage(AverageType, close, 12) -
MovingAverage(AverageType, close, 26);
def isOrangeDot = (MACD - ExpAverage(MACD, 9)) > (MACD[1] - ExpAverage(MACD[1], 9)) > 0
and (volume > (0.90 * Average(volume,50)) > 0);
# PGO
def PGO = isGreenDot and isPurpleDot and isOrangeDot;
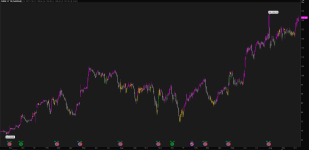
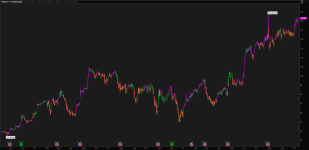
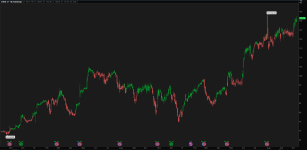
AssignPriceColor (
if colorPGO and PGO then COLOR.GREEN else
if colorPGO and isPurpleDot then COLOR.MAGENTA else
if colorPGO and isOrangeDot then COLOR.ORANGE else
if colorPGO and isGreenDot then COLOR.DARK_GREEN else
if colorErgodic and ErgodiIndicator >= 0 then Color.UPTICK else
if colorErgodic and ErgodiIndicator <= 0 then Color.DOWNTICK else
COLOR.GRAY);
#End OF PGO Indicator

")