3
3AMBH
Guest
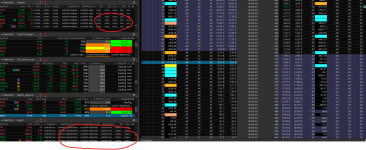
Script is for Options chain under Trade Tab to show highlighted Gamma
Hi, Please see post https://usethinkscript.com/threads/options-gamma-study.11951/page-5#posts in order to see history. The following script works for a member by the name of Focus. The same script does not work for me. He has sent this also and it does not work for me either https://tos.mx/VWf2UpO (This link shows up in my Watchlists selections)
Here is the script he posted: Can someone please tell me ahy it des not work for me and does work for Focus? Thanks
plot data = if IsPut() then gamma() * -100 * open_interest() else gamma() * 100 * open_interest();
def rangeHigh = Highestall (absvalue(data)) ;
assignbackgroundcolor (if absvalue(data) > 1000000 then color.white else if AbsValue(data) > 500000 then color.gray else if absvalue(data) > 200000 then color.green else if absvalue(data) > 100000 then color.yellow else if AbsValue(data) > 50000 then color.light_orange else if AbsValue(data) > 20000 then color.cyan else if AbsValue(data) > 9999 then createcolor(250,150,100) else color.black);
Last edited by a moderator: