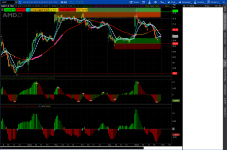
Here is another version of the Opening Range Breakout indicator I mentioned in this post.

Automatic Opening Range and Fibonacci Levels This Thinkscript is designed to plot the OR high, low, 50% fib retrace, and fib extensions for the current day. This will only work correctly on time-based charts, where the OR time frame is divisible by the bar period e.g. 30 minute OR, 10 min bars. An extra fib extension may be used if desired...
thinkScript Code
Rich (BB code):
#
def na=double.nan;
#
# Define time that OR begins (in hhmm format,
# 0930 is the default):
#
input ORBegin = 0930;
#
# Define time that OR is finished (in hhmm format,
# 10:00 is the default):
#
input OREnd = 1000;
#
# Input first and second fib extension levels
# (default 1.382, 1.621):
#
Input FibExt1=1.382;
Input FibExt2=1.621;
#
# Show Today only? (Default Yes)
#
input ShowTodayOnly={"No", default "Yes"};
def s=ShowTodayOnly;
#
# Show Second fib extension? (Default No)
#
input ShowFibExt2={default "No", "Yes"};
def sf2=ShowFibExt2;
#
# Create logic for OR definition:
#
Def ORActive = if secondstilltime(OREnd)>0 AND secondsfromtime(ORBegin)>=0 then 1 else 0;
#
# Create logic to paint only current day post-open:
#
def today=if s==0 OR getday()==getlastday() AND secondsfromtime(ORBegin)>=0 then 1 else 0;
#
# Track OR High:
#
Rec ORHigh = if ORHigh[1]==0 or ORActive[1]==0 AND ORActive==1 then high else if ORActive AND high>ORHigh[1] then high else ORHigh[1];
#
# Track OR Low:
#
Rec ORLow = if ORLow[1]==0 or ORActive[1]==0 AND ORActive==1 then low else if ORActive AND low<ORLow[1] then low else ORLow[1];
#
# Calculate OR width:
#
Def ORWidth = ORHigh - ORLow;
#
# Calculate fib levels:
#
Def fib_mid = (ORHigh+ORLow)/2;
Def fib_ext_up1 = ORHigh + ORWidth*(FibExt1 - 1);
Def fib_ext_down1 = ORLow - ORWidth*(FibExt1 - 1);
Def fib_ext_up2= ORHigh + ORWidth*(FibExt2 - 1);
Def fib_ext_down2 = ORLow - ORWidth*(FibExt2 - 1);
#
# Define all the plots:
#
Plot ORH=if ORActive OR today<1 then na else ORHigh;
Plot ORL=if ORActive OR today<1 then na else ORLow;
Plot FibMid=if ORActive OR today<1 then na else fib_mid;
Plot FibExtUp1=if ORActive OR today<1 then na else fib_ext_up1;
Plot FibExtDown1=if ORActive OR today<1 then na else fib_ext_down1;
Plot FibExtUp2=if ORActive OR today<1 OR sf2<1 then na else fib_ext_up2;
Plot FibExtDown2=if ORActive OR today<1 OR sf2<1 then na else fib_ext_down2;
#
# Formatting:
#
ORH.setdefaultcolor(color.green);
ORH.setStyle(curve.Long_DASH);
ORH.setlineweight(3);
ORL.setdefaultcolor(color.red);
ORL.setStyle(curve.Long_DASH);
ORL.setlineweight(3);
FibMid.setdefaultcolor(color.gray);
FibMid.setStyle(curve.SHORT_DASH);
FibMid.setlineweight(3);
FibExtUp1.setdefaultcolor(color.green);
FibExtUp1.setStyle(curve.SHORT_DASH);
FibExtUp1.setlineweight(2);
FibExtDown1.setdefaultcolor(color.red);
FibExtDown1.setStyle(curve.SHORT_DASH);
FibExtDown1.setlineweight(2);
FibExtUp2.setdefaultcolor(color.green);
FibExtUp2.setStyle(curve.SHORT_DASH);
FibExtUp2.setlineweight(1);
FibExtDown2.setdefaultcolor(color.red);
FibExtDown2.setStyle(curve.SHORT_DASH);
FibExtDown2.setlineweight(1);
Shareable Link
https://tos.mx/2PO45h
Last edited:

