We're releasing our first algo for ThinkorSwim based on the Opening Range Breakout indicator. Although calling it an algo, it's simply just a strategy that plot buy and sell signals on your chart. Auto trade isn't supported in ThinkorSwim at the moment so you still have to execute the trade on your own.
The indicator and strategy were developed to solve our own problem. Using the standard ORB indicator, we saw that there were a lot of false breakouts. So we asked ourselves how can we solve this problem.
Here is what we added:
We learned that when a breakout or breakdown happen while the market is calm or quiet (not trending) then most likely it's going to be a false signal. As a result, using the Market Volatility that we found was the perfect solution.
Next, sometimes a stock would breakout or breakdown near market close. We don't want that. So we added a time filter into the indicator. This would tell the algo to stop giving us signals an hour before the market closing time.
Lastly, using EMA crossover also helps to confirm the trend indicated by the algo. If there is no crossover then there is no trade. Ultimately, all 3 components have to agree in order for the buy and sell signals to be produced.
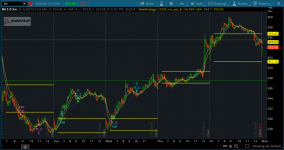
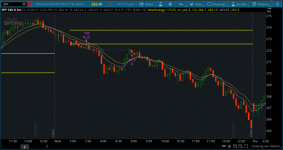
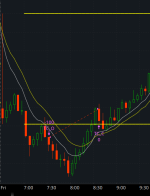
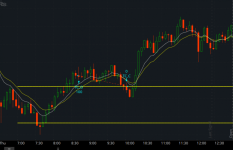
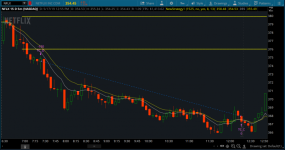
I'm happy to share with you some outstanding results.


By adding 3 additional conditions into the indicator, we were able to produce a great trading strategy. However, you may still be able to spot some fake breakouts and breakdowns on the chart. Now it's up to you to use your skills to identify these false signals and not to take the trade.
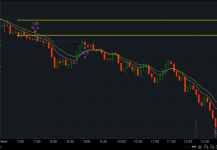
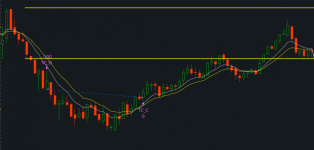
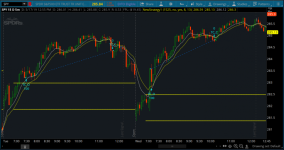
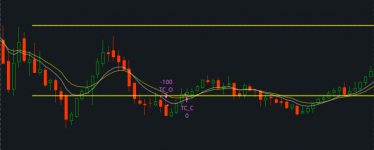
Additionally, we also implemented the EMA crossover rule so that even if the algo is wrong it will still be able to cut losses early.

We recommend that you take partial profit to avoid incident like this.

If you have any issues, recommendations, or questions while using the algo please comment down below.
Credits:
The indicator and strategy were developed to solve our own problem. Using the standard ORB indicator, we saw that there were a lot of false breakouts. So we asked ourselves how can we solve this problem.
How Did We Get to This Point?
The biggest issue with the Opening Range indicator is false breakouts and breakdowns. To do so, we added additional indicators into it.Here is what we added:
- Market Volatility
- Time Filter
- EMA Crossover
We learned that when a breakout or breakdown happen while the market is calm or quiet (not trending) then most likely it's going to be a false signal. As a result, using the Market Volatility that we found was the perfect solution.
Next, sometimes a stock would breakout or breakdown near market close. We don't want that. So we added a time filter into the indicator. This would tell the algo to stop giving us signals an hour before the market closing time.
Lastly, using EMA crossover also helps to confirm the trend indicated by the algo. If there is no crossover then there is no trade. Ultimately, all 3 components have to agree in order for the buy and sell signals to be produced.
Meet the Enhanced ORB Strategy
Rich (BB code):
# 30 min opening range Market Volatility V1.1
# Robert Payne
# Adapted to strategy by WalkingBallista and BenTen
# https://usethinkscript.com/threads/opening-range-breakout-strategy-with-market-volatility-for-thinkorswim.164/
script MV {
input atrlength = 14;
input avglength = 500;
input plotlower = {default "yes", "no"};
def vol = reference ATR(atrlength, averageType = AverageType.SIMPLE);
def avgvol = Average(vol, avglength);
def calm = vol < avgvol - (avgvol * .1);
def neutral = avgvol + (avgvol * .1) > vol > avgvol - (avgvol * .1);
def Volatile = vol > avgvol + (avgvol * .1);
AddLabel(yes, Concat("Market is Currently ", (if calm then "Calm" else if neutral then "Neutral" else if Volatile then "Volatile" else "Neutral")), if calm then Color.GREEN else if neutral then Color.BLUE else if Volatile then Color.RED else Color.GRAY);
declare lower;
plot window = vol - avgvol;
window.SetPaintingStrategy(PaintingStrategy.HISTOGRAM);
window.AssignValueColor(if Volatile then Color.RED else if calm then Color.GREEN else if neutral then Color.BLUE else Color.GRAY);
plot zeroline = 0;
};
def volatile = MV().volatile;
def OpenRangeMinutes = 30;
def MarketOpenTime = 0930;
def LastBar = SecondsFromTime(1530) == 0;
input TimeToStopSignal = 1525;
def TradeTimeFilter = SecondsFromTime(TimeToStopSignal);
input ShowTodayOnly = no;
input UseEMACross = yes;
input ema1_len = 8;
input ema2_len = 13;
AddVerticalLine(SecondsFromTime(0930)==0,"Open",Color.Gray,Curve.SHORT_DASH);
AddVerticalLine(!TradeTimeFilter,"Last Signal",Color.Dark_Gray,Curve.SHORT_DASH);
def Today = if GetDay() == GetLastDay() then 1 else 0;
def FirstMinute = if SecondsFromTime(MarketOpenTime) < 60 then 1 else 0;
def OpenRangeTime = if SecondsFromTime(MarketOpenTime) < 60 * OpenRangeMinutes then 1 else 0;
def ORHigh = if FirstMinute then high else if OpenRangeTime and high > ORHigh[1] then high else ORHigh[1];
def ORLow = if FirstMinute then low else if OpenRangeTime and low < ORLow[1] then low else ORLow[1];
plot OpenRangeHigh = if ShowTodayOnly and !Today then Double.NaN else if !OpenRangeTime then ORHigh else Double.NaN;
plot OpenRangeLow = if ShowTodayOnly and !Today then Double.NaN else if !OpenRangeTime then ORLow else Double.NaN;
OpenRangeHigh.SetPaintingStrategy(PaintingStrategy.HORIZONTAL);
OpenRangeHigh.SetDefaultColor(Color.YELLOW);
OpenRangeHigh.SetLineWeight(2);
OpenRangeLow.SetPaintingStrategy(PaintingStrategy.HORIZONTAL);
OpenRangeLow.SetDefaultColor(Color.YELLOW);
OpenRangeLow.SetLineWeight(2);
def dailyRange = high(period = "day" )[1] - low(period = "day" )[1];
def range = Average(dailyRange, 10);
plot ema1 = MovAvgExponential(length=ema1_len);
plot ema2 = MovAvgExponential(length=ema2_len);
# Bullish
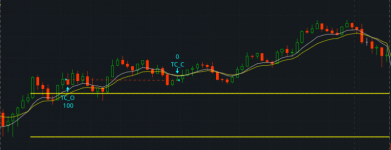
AddOrder(OrderType.BUY_TO_OPEN, ((!UseEmaCross AND close crosses above OpenRangeHigh) OR (UseEMACross AND ema1 crosses above OpenRangeHigh)) and TradeTimeFilter < 1 and volatile, tradeSize = 100, tickcolor = GetColor(1), arrowcolor = GetColor(1), name = "TC_O");
AddOrder(OrderType.SELL_TO_CLOSE, ema1 crosses below ema2 or (close < OpenRangeHigh) or LastBar, tickcolor = GetColor(1), arrowcolor = GetColor(1), name = "TC_C");
# Bearish
AddOrder(OrderType.SELL_TO_OPEN, ((!UseEmaCross AND close crosses below OpenRangeLow) OR (UseEMACross AND ema1 crosses below OpenRangeLow)) and TradeTimeFilter < 1 and volatile, tradeSize = 100, tickcolor = GetColor(2), arrowcolor = GetColor(2), name = "TC_O");
AddOrder(OrderType.BUY_TO_CLOSE, ema1 crosses above ema2 or (close > OpenRangeLow) or LastBar, tickcolor = GetColor(2), arrowcolor = GetColor(2), name = "TC_C");I'm happy to share with you some outstanding results.
Over to You!
Those are just some of the most successful plays we had from last week. But don't get too excited just yet because like any other indicators, this one also has its own weakness.By adding 3 additional conditions into the indicator, we were able to produce a great trading strategy. However, you may still be able to spot some fake breakouts and breakdowns on the chart. Now it's up to you to use your skills to identify these false signals and not to take the trade.
Additionally, we also implemented the EMA crossover rule so that even if the algo is wrong it will still be able to cut losses early.
We recommend that you take partial profit to avoid incident like this.
If you have any issues, recommendations, or questions while using the algo please comment down below.
Credits:
- I can't thank @WalkingBallista enough for helping me code all of my ideas into one script. Sometimes we would be up until 1-2 am working on the strategy. If you're in our Discord chatroom please drop him a like 😀.
- Robert Payne for the original ORB indicator
Attachments
Last edited: