Here is a scanner for the ORB indicator (Opening Range Breakout) that you can run in your ThinkorSwim. Get alerted for when a stock is breaking out or breaking down as they happen.
Add the ORB indicator if you haven't done so.
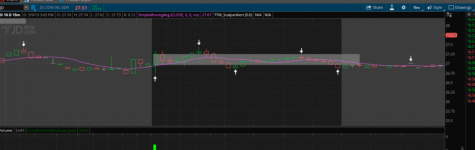
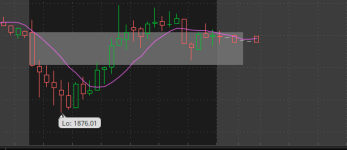
Anyways, here's what the Opening Range setup looks like on my chart.


Click on the Pencil icon > Delete any existing conditions that ThinkorSwim gave you. Then, click Add condition.
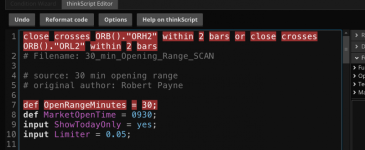
Under -Select a Condition- > Select Price > Close. For the middle field, choose crosses. On the right field, select your ORB indicator. Under plot > ORH2 within 2 bars. Altogether you'll have something like this.

Repeat the same process again, begin with adding a new condition then under Plot select ORL2.

Make sure all the options are the same in this picture. As for as aggregation period, I have it set to the 5 min timeframe. However, you can change it to whichever timeframe you use your ORB indicator on.

Click Ok and click the green Scan button. You should be good to go. Enjoy")
Add the ORB indicator if you haven't done so.
thinkScript Code
Rich (BB code):
# Clayburgs Directional Day Filter
# Written by KumoBob Dec 31 2009

# Thanks to ThinkScriptor and aPPLE_PI for helping me with the secondsfromtime() function by showing me the code writen by Prospectus in his Opening Range study.


# Directional Day Filter Line - After the first five minutes calculate the average range for this 5-minute bar. Draw a horizontal line at this level.
# Time Line - Draw a vertical line at 60-minute bar (Low to High of the day so far).
# (slower value for faster moving charts like currency and S&P – Faster value for slower moving charts) (45 minutes to 90 minutes)
# Determine the amount of activity above and below the Directional Day Filter Line prior to the Time Line.
# (A rectangle can be drawn with Blue shading above and Red below the Directional Day Filter Line)
# If the majority of the activity is above the Directional Day Filter Line the trend bias for the day will be higher.
# If the majority of the activity is below the Directional Day Filter Line the trend bias for the day will be lower.
# If it's even the day will most likely be flat.
# If the closing bar on the Time Line is within 1/3 the distance from the Directional Day Filter Line then added bias can be anticipated.

#hint: Best used in a 1 to 5 minute chart period


def na = double.nan;
############### Directional Day Filter Line ##############


input ORBegin = 0930;
input OREnd = 0935;
# Show Today only? (Default Yes)
input ShowTodayOnly = { default "No", "Yes"};
def s = ShowTodayOnly;
# Create logic for OR definition: 1 if between fist 5 minutes
Def ORActive = if secondsTillTime(OREnd) > 0 AND secondsFromTime(ORBegin) >= 0 then 1 else 0;
# Create logic to paint only current day post-open:
def today = if s == 0 OR getDay() == getLastDay() AND secondsFromTime(ORBegin) >= 0 then 1 else 0;
# Track OR High:
Rec ORHigh = if ORHigh[1] == 0 or ORActive[1] == 0 AND ORActive == 1 then high else if ORActive AND high > ORHigh[1] then high else ORHigh[1];
# Track OR Low:
Rec ORLow = if ORLow[1] == 0 or ORActive[1] == 0 AND ORActive == 1 then low else if ORActive AND low < ORLow[1] then low else ORLow[1];
# Calculate OR width:
Def ORWidth = ORHigh - ORLow;
# Define all the plots:
Def ORHA = if ORActive OR today < 1 then na else ORHigh;
Def ORLA = if ORActive OR today < 1 then na else ORLow;
Def O = ORHA - (ORHA - ORLA) / 2;
Plot ORL = if (o == 0 , na, o);
ORL.SetDefaultColor(color.Yellow);
ORL.SetStyle(curve.Long_DASH);
ORL.SetLineWeight(3);

################## Time Line #####################

input ORBegin2 = 0930;
# Define time that OR is finished (in hhmm format,
# 10:00 is the default):
input OREnd2 = 1030;
# Show Today only? (Default Yes)
####input ShowTodayOnly={"No", default "Yes"};
####def s=ShowTodayOnly;
# Create logic for OR definition:
Def ORActive2 = if secondsTillTime(OREnd2) > 0 AND secondsFromTime(ORBegin2) >= 0 then 1 else 0;
# Create logic to paint only current day post-open:
#####def today=if s==0 OR getday()==getlastday() AND secondsfromtime(ORBegin2)>=0 then 1 else 0;
# Track OR High:
Rec ORHigh2 = if ORHigh2[1] == 0 or ORActive2[1] == 0 AND ORActive2 == 1 then high else if ORActive2 AND high > ORHigh2[1] then high else ORHigh2[1];
# Track OR Low:
Rec ORLow2 = if ORLow2[1] == 0 or ORActive2[1] == 0 AND ORActive2 == 1 then low else if ORActive2 AND low < ORLow2[1] then low else ORLow2[1];
# Calculate OR width:
Def ORWidth2 = ORHigh2 - ORLow2;
# Define all the plots:
Plot ORH2 = if ORActive2 OR today < 1 then na else ORHigh2;
Plot ORL2 = if ORActive2 OR today < 1 then na else ORLow2;
# Formatting:
ORH2.SetDefaultColor(color.green);
ORH2.SetStyle(curve.Long_DASH);
ORH2.SetLineWeight(3);
ORL2.SetDefaultColor(color.red);
ORL2.SetStyle(curve.Long_DASH);
ORL2.SetLineWeight(3);

################################
Def TimeLine = if secondsTillTime(OREnd2) == 0 then 1 else 0;

Def pos = (ORH2 - ORL2) / 10;

plot d1 = if (TimeLine , ORH2, na);
plot d2 = if (TimeLine , ORH2 - ( pos * 2), na);
plot d3 = if (TimeLine , ORH2 - ( pos * 3), na);
plot d4 = if (TimeLine , ORH2 - ( pos * 4), na);
plot d5 = if (TimeLine , ORH2 - ( pos * 5), na);
plot d6 = if (TimeLine , ORH2 - ( pos * 6), na);
plot d7 = if (TimeLine , ORH2 - ( pos * 7), na);
plot d8 = if (TimeLine , ORH2 - ( pos * 8), na);
plot d9 = if (TimeLine , ORH2 - ( pos * 9), na);
plot d10 = if (TimeLine , (ORL2), na);

d1.SetPaintingStrategy(PaintingStrategy.arrow_down);
d2.SetPaintingStrategy(PaintingStrategy.POINTS);
d3.SetPaintingStrategy(PaintingStrategy.POINTS);
d4.SetPaintingStrategy(PaintingStrategy.POINTS);
d5.SetPaintingStrategy(PaintingStrategy.POINTS);
d6.SetPaintingStrategy(PaintingStrategy.POINTS);
d7.SetPaintingStrategy(PaintingStrategy.POINTS);
d8.SetPaintingStrategy(PaintingStrategy.POINTS);
d9.SetPaintingStrategy(PaintingStrategy.POINTS);
d10.SetPaintingStrategy(PaintingStrategy.ARROW_UP);


d2.HideBubble();
d3.HideBubble();
d4.HideBubble();
d5.HideBubble();
d6.HideBubble();
d7.HideBubble();
d8.HideBubble();
d9.HideBubble();


DEF Span = (O - ORL2) / (ORH2 - ORL2);
rec colorState = if Span > 0.66 then -1
else if Span < 0.33 then 1 else 0;


d1.AssignValueColor(
if colorState < 0 then Color.RED else
if colorState > 0 then Color.GREEN else
Color.Yellow
);

d2.AssignValueColor(
if colorState < 0 then Color.RED else
if colorState > 0 then Color.GREEN else
Color.Yellow
);

d3.AssignValueColor(
if colorState < 0 then Color.RED else
if colorState > 0 then Color.GREEN else
Color.Yellow
);

d4.AssignValueColor(
if colorState < 0 then Color.RED else
if colorState > 0 then Color.GREEN else
Color.Yellow
);

d5.AssignValueColor(
if colorState < 0 then Color.RED else
if colorState > 0 then Color.GREEN else
Color.Yellow
);

d6.AssignValueColor(
if colorState < 0 then Color.RED else
if colorState > 0 then Color.GREEN else
Color.Yellow
);

d7.AssignValueColor(
if colorState < 0 then Color.RED else
if colorState > 0 then Color.GREEN else
Color.Yellow
);

d8.AssignValueColor(
if colorState < 0 then Color.RED else
if colorState > 0 then Color.GREEN else
Color.Yellow
);

d9.AssignValueColor(
if colorState < 0 then Color.RED else
if colorState > 0 then Color.GREEN else
Color.Yellow
);

d10.AssignValueColor(
if colorState < 0 then Color.RED else
if colorState > 0 then Color.red else
Color.Yellow
);
d1.SetLineWeight(5);
d2.SetLineWeight(5);
d3.SetLineWeight(5);
d4.SetLineWeight(5);
d5.SetLineWeight(5);
d6.SetLineWeight(5);
d7.SetLineWeight(5);
d8.SetLineWeight(5);
d9.SetLineWeight(5);
d10.SetLineWeight(5);

#######################################################################


Def TimeLineb = if secondsTillTime(OREND) == 0 then 1 else 0;

Def posbd = (ORHA - ORLA) / 10;

plot bd1 = if (TimeLineb , ORHA, na);
plot bd2 = if (TimeLineb , ORHA - ( posbd * 2), na);
plot bd3 = if (TimeLineb , ORHA - ( posbd * 3), na);
plot bd4 = if (TimeLineb , ORHA - ( posbd * 4), na);
plot bd5 = if (TimeLineb , ORHA - ( posbd * 5), na);
plot bd6 = if (TimeLineb , ORHA - ( posbd * 6), na);
plot bd7 = if (TimeLineb , ORHA - ( posbd * 7), na);
plot bd8 = if (TimeLineb , ORHA - ( posbd * 8), na);
plot bd9 = if (TimeLineb , ORHA - ( posbd * 9), na);
plot bd10 = if (TimeLineb , (ORL2), na);

bd1.SetPaintingStrategy(PaintingStrategy.POINTS);
bd2.SetPaintingStrategy(PaintingStrategy.POINTS);
bd3.SetPaintingStrategy(PaintingStrategy.POINTS);
bd4.SetPaintingStrategy(PaintingStrategy.POINTS);
bd5.SetPaintingStrategy(PaintingStrategy.POINTS);
bd6.SetPaintingStrategy(PaintingStrategy.POINTS);
bd7.SetPaintingStrategy(PaintingStrategy.POINTS);
bd8.SetPaintingStrategy(PaintingStrategy.POINTS);
bd9.SetPaintingStrategy(PaintingStrategy.POINTS);
bd10.SetPaintingStrategy(PaintingStrategy.POINTS);

bd1.SetDefaultColor(Color.YELLOW);
bd2.SetDefaultColor(Color.YELLOW);
bd3.SetDefaultColor(Color.YELLOW);
bd4.SetDefaultColor(Color.YELLOW);
bd5.SetDefaultColor(Color.YELLOW);
bd6.SetDefaultColor(Color.YELLOW);
bd7.SetDefaultColor(Color.YELLOW);
bd8.SetDefaultColor(Color.YELLOW);
bd9.SetDefaultColor(Color.YELLOW);
bd10.SetDefaultColor(Color.YELLOW);

bd1.HideBubble();
bd2.HideBubble();
bd3.HideBubble();
bd4.HideBubble();
bd5.HideBubble();
bd6.HideBubble();
bd7.HideBubble();
bd8.HideBubble();
bd9.HideBubble();
bd10.HideBubble();

AddCloud(ORL2, ORH2, color.green, color.green);
#def aggregation = if getAggregationPeriod() == (AggregationPeriod.MIN * 5) or (AggregationPeriod.MIN * 10) or (AggregationPeriod.MIN * 15) then 1 else 0 ;
def aggregation = 1;
The Setup
I made some changes to the indicator. Mostly cosmetic stuff so it's easier for me to look at. Basically, I just wanted to know where the Bull Zone and Bear Zone are. Some of you may remember that from the previous ORB post.Anyways, here's what the Opening Range setup looks like on my chart.
Getting Started with Opening Rage Scanner
Once you installed the indicator, switch over the the Scan tab. Here you want to click on Add study filter.Click on the Pencil icon > Delete any existing conditions that ThinkorSwim gave you. Then, click Add condition.
Under -Select a Condition- > Select Price > Close. For the middle field, choose crosses. On the right field, select your ORB indicator. Under plot > ORH2 within 2 bars. Altogether you'll have something like this.
Repeat the same process again, begin with adding a new condition then under Plot select ORL2.
Make sure all the options are the same in this picture. As for as aggregation period, I have it set to the 5 min timeframe. However, you can change it to whichever timeframe you use your ORB indicator on.
Click Ok and click the green Scan button. You should be good to go. Enjoy
Last edited: