
15minofpham
New member
Ben,
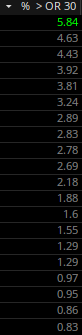
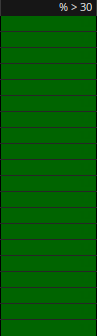
Is there a way to populate the column with a number instead of just a color?
Is there a way to populate the column with a number instead of just a color?
Last edited:
useThinkScript is the #1 community of stock market investors using indicators and other tools to power their trading strategies. Traders of all skill levels use our forums to learn about scripting and indicators, help each other, and discover new ways to gain an edge in the markets.
We get it. Our forum can be intimidating, if not overwhelming. With thousands of topics, tens of thousands of posts, our community has created an incredibly deep knowledge base for stock traders. No one can ever exhaust every resource provided on our site.
If you are new, or just looking for guidance, here are some helpful links to get you started.
![voE9g9E.png"][upl-image-preview](/proxy.php?image=https%3A%2F%2Fi.imgur.com%2FvoE9g9E.png%22%5D%5Bupl-image-preview&hash=5b05e736da90372953ed9884a9e51f25)

") Happy to help if I can...
Happy to help if I can...