
You should upgrade or use an alternative browser.
Open price of red candle and EMA 34
- Thread starter Daniel
- Start date
- No you don't have to change your time zone
- Can not be used on daily
- set your timeframe to any intraday increment
We can't scan for "the open price of red candle on the right side equal to the opening price of red candle on the left side" as right side -- left side are not adequately defined.
Yell, if you have more questions.
Here's an example:
Open is greater than or equal to EMA34
For request #4:
The open price of this particular red candle has to be equal to one of the previous opened price of red candle since the market opened on daily 1 min chart
You need to identify and define "this particular red candle" in a way that the TOS scanner can understand. I doubt it's possible unless you go into the specifics of it.
Join useThinkScript to post your question to a community of 21,000+ developers and traders.
I rarely write scans, so i'm not sure if this will work as a scan study, i didn't test it.
instead of looking for an exact match, i chose to check if the difference between 2 prices is less than a small number. ( i didn't want to miss a match, because one price has 4 decimal places and the other doesn't)
this is meant to be used during normal trading hours, not after hours.
there are bubbles that can be turned on, that show some variable values, barnumbers and bar counts.
can turn on labels that show similar data.
this is an upper chart study
during the current day,
when the current candle is moving down, (close < open)
look at previous candles,
search for and find the first match, a down candle with a similar open price.
a price match occurs when both opens are within a max difference. default is 0.005
an image with arrows
# findprevopen_01

# -------------------
# halcyonguy
# 05/24/2021
# -------------------
# upper chart study
#  during the current day,
#  when the current candle is moving down, (close < open)
#  look at previous candles,
#  search for and find the first match, a down candle with a similar open price.
#   a price match occurs when both opens are within a max difference, default is 0.005
#
# -------------------
# https://usethinkscript.com/threads/open-price-of-red-candle-and-ema-34.6603/
#  trying to create scanner criteria
#   rule 4. has to be
#    'The open price of this particular red candle has to be equal to one of the
#    previous opened price of red candle since the market opened on daily 1 min chart'
# -------------------

def redbar = open > close;
def na = double.nan;
def bn = barnumber();

def istoday = if GetLastDay() == GetDay() then 1 else 0;

#  390 min in a 6.5 hour trading day
def daymin = 390;
def chartagg = GetAggregationPeriod();
def chartmin = chartagg / (1000 * 60);
def chartbars = daymin/chartmin;

# get min from start time. calc qty bars so far today
def start = 0930;
def elapsedmin = (secondsfromTime(start) / 60);
def elapsedbars = elapsedmin / chartmin;

# -------------------

input show_arrow_when_triggered = yes;
input show_trigger_values = no;

input max_price_diff_for_match = 0.005;
input show_labels = no;

input test_show_barnumber_bubbles = no;
input test_bubbles1_daily_minutes_barnums = no;

# -----------------------------

def vertbubbleoffset = 0.001;

addlabel(show_labels, "open price difference max " + max_price_diff_for_match, color.yellow);
addlabel(show_labels, "chart min " + chartmin, color.yellow);
addlabel(show_labels, "bars / day " + chartbars, color.yellow);

# loop thru just the bars during the current day, looking for a price match
def x = fold  i = 1 to (elapsedbars + 1)
  with p = 1
  while (istoday and (absvalue(open - getvalue(open, i)) > max_price_diff_for_match) )
  do i;

# ====================================

# adjust the offset
def x2 = x + 1;

#  when loop finds a price match, check if prev bar and current bar are red
def redbars = ( (x > 1 and x < elapsedbars) and getvalue(redbar, x2) and redbar);

def vertlo = 1 - vertbubbleoffset;
addchartbubble(show_trigger_values and redbars, low * vertlo, "bn " + bn + "\nopen " + open + "\noffset " + x2 + "\nprev bn " + getvalue(bn, x2), color.yellow, no);

def verthi3 = 1 + (0.3 * vertbubbleoffset);
plot z = if  show_arrow_when_triggered and redbars then high * verthi3 else na;
z.SetPaintingStrategy(PaintingStrategy.arrow_down);
z.setlineweight(4);
z.setdefaultcolor(color.white);

# -------------------------

# test bubbles with barnumber. make 1st one of day white, rest gray
def vertlo2 = 1 - (0.3*vertbubbleoffset);
addchartbubble(test_show_barnumber_bubbles and elapsedmin == 0, low * vertlo2, bn, color.white, no);
addchartbubble(test_show_barnumber_bubbles and elapsedmin > 0, low * vertlo2, bn, color.gray, no);

# test bubbles
def verthi = 1 + (1 * vertbubbleoffset);
addchartbubble(test_bubbles1_daily_minutes_barnums and elapsedmin == 0, (high * verthi), "minutes:" + elapsedmin + "\n" + "barnumber:" + elapsedbars, color.yellow, yes);
addchartbubble(test_bubbles1_daily_minutes_barnums and elapsedmin > 0, high * verthi, elapsedmin + "\n" + elapsedbars, color.yellow, yes);
#
an image with yellow bubbles with values turned on
image with barnumber bubbles turned on
draw red lines to the prev bar that matches the open
Thank you so much for your detailed reply.this looked like an interesting problem, so i wrote an upper study to draw arrows on the bars with a matching, previous open price.
I rarely write scans, so i'm not sure if this will work as a scan study, i didn't test it.
instead of looking for an exact match, i chose to check if the difference between 2 prices is less than a small number. ( i didn't want to miss a match, because one price has 4 decimal places and the other doesn't)
this is meant to be used during normal trading hours, not after hours.
there are bubbles that can be turned on, that show some variable values, barnumbers and bar counts.
can turn on labels that show similar data.
this is an upper chart study
during the current day,
when the current candle is moving down, (close < open)
look at previous candles,
search for and find the first match, a down candle with a similar open price.
a price match occurs when both opens are within a max difference. default is 0.005
an image with arrows

Code:# findprevopen_01 # ------------------- # halcyonguy # 05/24/2021 # ------------------- # upper chart study # during the current day, # when the current candle is moving down, (close < open) # look at previous candles, # search for and find the first match, a down candle with a similar open price. # a price match occurs when both opens are within a max difference, default is 0.005 # # ------------------- # https://usethinkscript.com/threads/open-price-of-red-candle-and-ema-34.6603/ # trying to create scanner criteria # rule 4. has to be # 'The open price of this particular red candle has to be equal to one of the # previous opened price of red candle since the market opened on daily 1 min chart' # ------------------- def redbar = open > close; def na = double.nan; def bn = barnumber(); def istoday = if GetLastDay() == GetDay() then 1 else 0; # 390 min in a 6.5 hour trading day def daymin = 390; def chartagg = GetAggregationPeriod(); def chartmin = chartagg / (1000 * 60); def chartbars = daymin/chartmin; # get min from start time. calc qty bars so far today def start = 0930; def elapsedmin = (secondsfromTime(start) / 60); def elapsedbars = elapsedmin / chartmin; # ------------------- input show_arrow_when_triggered = yes; input show_trigger_values = no; input max_price_diff_for_match = 0.005; input show_labels = no; input test_show_barnumber_bubbles = no; input test_bubbles1_daily_minutes_barnums = no; # ----------------------------- def vertbubbleoffset = 0.001; addlabel(show_labels, "open price difference max " + max_price_diff_for_match, color.yellow); addlabel(show_labels, "chart min " + chartmin, color.yellow); addlabel(show_labels, "bars / day " + chartbars, color.yellow); # loop thru just the bars during the current day, looking for a price match def x = fold i = 1 to (elapsedbars + 1) with p = 1 while (istoday and (absvalue(open - getvalue(open, i)) > max_price_diff_for_match) ) do i; # ==================================== # adjust the offset def x2 = x + 1; # when loop finds a price match, check if prev bar and current bar are red def redbars = ( (x > 1 and x < elapsedbars) and getvalue(redbar, x2) and redbar); def vertlo = 1 - vertbubbleoffset; addchartbubble(show_trigger_values and redbars, low * vertlo, "bn " + bn + "\nopen " + open + "\noffset " + x2 + "\nprev bn " + getvalue(bn, x2), color.yellow, no); def verthi3 = 1 + (0.3 * vertbubbleoffset); plot z = if show_arrow_when_triggered and redbars then high * verthi3 else na; z.SetPaintingStrategy(PaintingStrategy.arrow_down); z.setlineweight(4); z.setdefaultcolor(color.white); # ------------------------- # test bubbles with barnumber. make 1st one of day white, rest gray def vertlo2 = 1 - (0.3*vertbubbleoffset); addchartbubble(test_show_barnumber_bubbles and elapsedmin == 0, low * vertlo2, bn, color.white, no); addchartbubble(test_show_barnumber_bubbles and elapsedmin > 0, low * vertlo2, bn, color.gray, no); # test bubbles def verthi = 1 + (1 * vertbubbleoffset); addchartbubble(test_bubbles1_daily_minutes_barnums and elapsedmin == 0, (high * verthi), "minutes:" + elapsedmin + "\n" + "barnumber:" + elapsedbars, color.yellow, yes); addchartbubble(test_bubbles1_daily_minutes_barnums and elapsedmin > 0, high * verthi, elapsedmin + "\n" + elapsedbars, color.yellow, yes); #
an image with yellow bubbles with values turned on

image with barnumber bubbles turned on
draw red lines to the prev bar that matches the open

I will test it.
hi daniel, please go reread my post again. it is an upper study, not a scan.halcyonguy,
how are you?
i see few sections here, which one is the scanner?
Thank you!
" , so i wrote an upper study to draw arrows on the bars with a matching, previous open price.
I rarely write scans, so i'm not sure if this will work as a scan study, i didn't test it."
..
it is all one study. sometimes i add a row of characters between different sub sections of a study, to separate the different sections.
i haven't done much experimenting with scanner scripts, so i don't know if fold loops work the same when used in scan studies.
i will make another version , for a lower study. then theoretically you can remove the declare lower line and use it as a scan, but no guarantees.
here is a lower study. it plots a 1 when a match is found, a previous price matches the current price.
to try this as a scan study, remove the line
declare lower;
# findprevopen_01b_lower

# change upper to a lower
# to possibly be used in a scanner
#  disable labels
#  disable bubbles
#  convert plots to def.  have just 1 plot ,  1 or 0


# findprevopen_01

# -------------------
# halcyonguy
# 05/24/2021
# -------------------
# upper chart study
#  during the current day,
#  when the current candle is moving down, (close < open)
#  look at previous candles,
#  search for and find the first match, a down candle with a similar open price.
#   a price match occurs when both opens are within a max difference, default is 0.005
#
# -------------------
# https://usethinkscript.com/threads/open-price-of-red-candle-and-ema-34.6603/
#  trying to create scanner criteria
#   rule 4. has to be
#    'The open price of this particular red candle has to be equal to one of the
#    previous opened price of red candle since the market opened on daily 1 min chart'
# -------------------

declare lower;

def redbar = open > close;
def na = double.nan;
def bn = barnumber();

def istoday = if GetLastDay() == GetDay() then 1 else 0;

#  390 min in a 6.5 hour trading day
def daymin = 390;
def chartagg = GetAggregationPeriod();
def chartmin = chartagg / (1000 * 60);
def chartbars = daymin/chartmin;

# get min from start time. calc qty bars so far today
def start = 0930;
def elapsedmin = (secondsfromTime(start) / 60);
def elapsedbars = elapsedmin / chartmin;

# -------------------

input show_arrow_when_triggered = yes;
input show_trigger_values = no;

input max_price_diff_for_match = 0.005;
input show_labels = no;

input test_show_barnumber_bubbles = no;
input test_bubbles1_daily_minutes_barnums = no;

# -----------------------------

def vertbubbleoffset = 0.001;

#addlabel(show_labels, "open price difference max " + max_price_diff_for_match, color.yellow);
#addlabel(show_labels, "chart min " + chartmin, color.yellow);
#addlabel(show_labels, "bars / day " + chartbars, color.yellow);

# loop thru just the bars during the current day, looking for a price match
def x = fold  i = 1 to (elapsedbars + 1)
  with p = 1
  while (istoday and (absvalue(open - getvalue(open, i)) > max_price_diff_for_match) )
  do i;

# ====================================

# adjust the offset
def x2 = x + 1;

#  when loop finds a price match, check if prev bar and current bar are red
def redbars = ( (x > 1 and x < elapsedbars) and getvalue(redbar, x2) and redbar);

def vertlo = 1 - vertbubbleoffset;
#addchartbubble(show_trigger_values and redbars, low * vertlo, "bn " + bn + "\nopen " + open + "\noffset " + x2 + "\nprev bn " + getvalue(bn, x2), color.yellow, no);

def verthi3 = 1 + (0.3 * vertbubbleoffset);
#plot z = if  show_arrow_when_triggered and redbars then high * verthi3 else na;
#z.SetPaintingStrategy(PaintingStrategy.arrow_down);
#z.setlineweight(4);
#z.setdefaultcolor(color.white);

# if a previous price that matches the currect price, is found, plot a 1
plot z = if redbars then 1 else 0;

# -------------------------

# test bubbles with barnumber. make 1st one of day white, rest gray
def vertlo2 = 1 - (0.3*vertbubbleoffset);
#addchartbubble(test_show_barnumber_bubbles and elapsedmin == 0, low * vertlo2, bn, color.white, no);
#addchartbubble(test_show_barnumber_bubbles and elapsedmin > 0, low * vertlo2, bn, color.gray, no);

# test bubbles
def verthi = 1 + (1 * vertbubbleoffset);
#addchartbubble(test_bubbles1_daily_minutes_barnums and elapsedmin == 0, (high * verthi), "minutes:" + elapsedmin + "\n" + "barnumber:" + elapsedbars, color.yellow, yes);
#addchartbubble(test_bubbles1_daily_minutes_barnums and elapsedmin > 0, high * verthi, elapsedmin + "\n" + elapsedbars, color.yellow, yes);

#addchartbubble(yes, low, istoday, color.green,no);
#
in the picture, the top chart is the original study, drawing arrows when a match is found.
the lower part is this lower study, plotting 1 when a match is found
I got it...thanks do much for your reply.i didn't test this as a scan, which is why i am posting this as a lower study
here is a lower study. it plots a 1 when a match is found, a previous price matches the current price.
to try this as a scan study, remove the line
declare lower;
Python:# findprevopen_01b_lower # change upper to a lower # to possibly be used in a scanner # disable labels # disable bubbles # convert plots to def. have just 1 plot , 1 or 0 # findprevopen_01 # ------------------- # halcyonguy # 05/24/2021 # ------------------- # upper chart study # during the current day, # when the current candle is moving down, (close < open) # look at previous candles, # search for and find the first match, a down candle with a similar open price. # a price match occurs when both opens are within a max difference, default is 0.005 # # ------------------- # https://usethinkscript.com/threads/open-price-of-red-candle-and-ema-34.6603/ # trying to create scanner criteria # rule 4. has to be # 'The open price of this particular red candle has to be equal to one of the # previous opened price of red candle since the market opened on daily 1 min chart' # ------------------- declare lower; def redbar = open > close; def na = double.nan; def bn = barnumber(); def istoday = if GetLastDay() == GetDay() then 1 else 0; # 390 min in a 6.5 hour trading day def daymin = 390; def chartagg = GetAggregationPeriod(); def chartmin = chartagg / (1000 * 60); def chartbars = daymin/chartmin; # get min from start time. calc qty bars so far today def start = 0930; def elapsedmin = (secondsfromTime(start) / 60); def elapsedbars = elapsedmin / chartmin; # ------------------- input show_arrow_when_triggered = yes; input show_trigger_values = no; input max_price_diff_for_match = 0.005; input show_labels = no; input test_show_barnumber_bubbles = no; input test_bubbles1_daily_minutes_barnums = no; # ----------------------------- def vertbubbleoffset = 0.001; #addlabel(show_labels, "open price difference max " + max_price_diff_for_match, color.yellow); #addlabel(show_labels, "chart min " + chartmin, color.yellow); #addlabel(show_labels, "bars / day " + chartbars, color.yellow); # loop thru just the bars during the current day, looking for a price match def x = fold i = 1 to (elapsedbars + 1) with p = 1 while (istoday and (absvalue(open - getvalue(open, i)) > max_price_diff_for_match) ) do i; # ==================================== # adjust the offset def x2 = x + 1; # when loop finds a price match, check if prev bar and current bar are red def redbars = ( (x > 1 and x < elapsedbars) and getvalue(redbar, x2) and redbar); def vertlo = 1 - vertbubbleoffset; #addchartbubble(show_trigger_values and redbars, low * vertlo, "bn " + bn + "\nopen " + open + "\noffset " + x2 + "\nprev bn " + getvalue(bn, x2), color.yellow, no); def verthi3 = 1 + (0.3 * vertbubbleoffset); #plot z = if show_arrow_when_triggered and redbars then high * verthi3 else na; #z.SetPaintingStrategy(PaintingStrategy.arrow_down); #z.setlineweight(4); #z.setdefaultcolor(color.white); # if a previous price that matches the currect price, is found, plot a 1 plot z = if redbars then 1 else 0; # ------------------------- # test bubbles with barnumber. make 1st one of day white, rest gray def vertlo2 = 1 - (0.3*vertbubbleoffset); #addchartbubble(test_show_barnumber_bubbles and elapsedmin == 0, low * vertlo2, bn, color.white, no); #addchartbubble(test_show_barnumber_bubbles and elapsedmin > 0, low * vertlo2, bn, color.gray, no); # test bubbles def verthi = 1 + (1 * vertbubbleoffset); #addchartbubble(test_bubbles1_daily_minutes_barnums and elapsedmin == 0, (high * verthi), "minutes:" + elapsedmin + "\n" + "barnumber:" + elapsedbars, color.yellow, yes); #addchartbubble(test_bubbles1_daily_minutes_barnums and elapsedmin > 0, high * verthi, elapsedmin + "\n" + elapsedbars, color.yellow, yes); #addchartbubble(yes, low, istoday, color.green,no); #
in the picture, the top chart is the original study, drawing arrows when a match is found.
the lower part is this lower study, plotting 1 when a match is found

Thanks so much for your reply and attentioni didn't test this as a scan, which is why i am posting this as a lower study
here is a lower study. it plots a 1 when a match is found, a previous price matches the current price.
to try this as a scan study, remove the line
declare lower;
Python:# findprevopen_01b_lower # change upper to a lower # to possibly be used in a scanner # disable labels # disable bubbles # convert plots to def. have just 1 plot , 1 or 0 # findprevopen_01 # ------------------- # halcyonguy # 05/24/2021 # ------------------- # upper chart study # during the current day, # when the current candle is moving down, (close < open) # look at previous candles, # search for and find the first match, a down candle with a similar open price. # a price match occurs when both opens are within a max difference, default is 0.005 # # ------------------- # https://usethinkscript.com/threads/open-price-of-red-candle-and-ema-34.6603/ # trying to create scanner criteria # rule 4. has to be # 'The open price of this particular red candle has to be equal to one of the # previous opened price of red candle since the market opened on daily 1 min chart' # ------------------- declare lower; def redbar = open > close; def na = double.nan; def bn = barnumber(); def istoday = if GetLastDay() == GetDay() then 1 else 0; # 390 min in a 6.5 hour trading day def daymin = 390; def chartagg = GetAggregationPeriod(); def chartmin = chartagg / (1000 * 60); def chartbars = daymin/chartmin; # get min from start time. calc qty bars so far today def start = 0930; def elapsedmin = (secondsfromTime(start) / 60); def elapsedbars = elapsedmin / chartmin; # ------------------- input show_arrow_when_triggered = yes; input show_trigger_values = no; input max_price_diff_for_match = 0.005; input show_labels = no; input test_show_barnumber_bubbles = no; input test_bubbles1_daily_minutes_barnums = no; # ----------------------------- def vertbubbleoffset = 0.001; #addlabel(show_labels, "open price difference max " + max_price_diff_for_match, color.yellow); #addlabel(show_labels, "chart min " + chartmin, color.yellow); #addlabel(show_labels, "bars / day " + chartbars, color.yellow); # loop thru just the bars during the current day, looking for a price match def x = fold i = 1 to (elapsedbars + 1) with p = 1 while (istoday and (absvalue(open - getvalue(open, i)) > max_price_diff_for_match) ) do i; # ==================================== # adjust the offset def x2 = x + 1; # when loop finds a price match, check if prev bar and current bar are red def redbars = ( (x > 1 and x < elapsedbars) and getvalue(redbar, x2) and redbar); def vertlo = 1 - vertbubbleoffset; #addchartbubble(show_trigger_values and redbars, low * vertlo, "bn " + bn + "\nopen " + open + "\noffset " + x2 + "\nprev bn " + getvalue(bn, x2), color.yellow, no); def verthi3 = 1 + (0.3 * vertbubbleoffset); #plot z = if show_arrow_when_triggered and redbars then high * verthi3 else na; #z.SetPaintingStrategy(PaintingStrategy.arrow_down); #z.setlineweight(4); #z.setdefaultcolor(color.white); # if a previous price that matches the currect price, is found, plot a 1 plot z = if redbars then 1 else 0; # ------------------------- # test bubbles with barnumber. make 1st one of day white, rest gray def vertlo2 = 1 - (0.3*vertbubbleoffset); #addchartbubble(test_show_barnumber_bubbles and elapsedmin == 0, low * vertlo2, bn, color.white, no); #addchartbubble(test_show_barnumber_bubbles and elapsedmin > 0, low * vertlo2, bn, color.gray, no); # test bubbles def verthi = 1 + (1 * vertbubbleoffset); #addchartbubble(test_bubbles1_daily_minutes_barnums and elapsedmin == 0, (high * verthi), "minutes:" + elapsedmin + "\n" + "barnumber:" + elapsedbars, color.yellow, yes); #addchartbubble(test_bubbles1_daily_minutes_barnums and elapsedmin > 0, high * verthi, elapsedmin + "\n" + elapsedbars, color.yellow, yes); #addchartbubble(yes, low, istoday, color.green,no); #
in the picture, the top chart is the original study, drawing arrows when a match is found.
the lower part is this lower study, plotting 1 when a match is found


I am out of my home I will check it out later on
Thank you for you quick reply
Daniel.
Hi again
SET UP STUDY: ( i named it RED_CANDLE) ( everything looks alright to me)
SET UP SCAN :
i selected RED_CANDLE on my scan
I set it up on my scan as RED_CANDLE (plot z) IS true WITHIN 1 BARS , than i save it and click OK ( everything looks alright to me)
But... when i switch between Day to Minute or extended time box , i am receiving errors that negate the save button.
and the scan button can not be used.
Two questions:
1. We are asking the scan to search for red candle when the market open 09:30, is it the reason why changing the time frame to day or minutes causing me a problem?
2.i am in Los angeles ,do i have to change the time in the script from 0930; to 06:30am? because the market open at 06:30am los angeles times?
# get min from start time. calc qty bars so far today
def start = 0930;
def elapsedmin = (secondsfromTime(start) / 60);
def elapsedbars = elapsedmin / chartmin;
Thank you so much for your help !
Daniel
Hithis looked like an interesting problem, so i wrote an upper study to draw arrows on the bars with a matching, previous open price.
I rarely write scans, so i'm not sure if this will work as a scan study, i didn't test it.
instead of looking for an exact match, i chose to check if the difference between 2 prices is less than a small number. ( i didn't want to miss a match, because one price has 4 decimal places and the other doesn't)
this is meant to be used during normal trading hours, not after hours.
there are bubbles that can be turned on, that show some variable values, barnumbers and bar counts.
can turn on labels that show similar data.
this is an upper chart study
during the current day,
when the current candle is moving down, (close < open)
look at previous candles,
search for and find the first match, a down candle with a similar open price.
a price match occurs when both opens are within a max difference. default is 0.005
an image with arrows

Code:# findprevopen_01 # ------------------- # halcyonguy # 05/24/2021 # ------------------- # upper chart study # during the current day, # when the current candle is moving down, (close < open) # look at previous candles, # search for and find the first match, a down candle with a similar open price. # a price match occurs when both opens are within a max difference, default is 0.005 # # ------------------- # https://usethinkscript.com/threads/open-price-of-red-candle-and-ema-34.6603/ # trying to create scanner criteria # rule 4. has to be # 'The open price of this particular red candle has to be equal to one of the # previous opened price of red candle since the market opened on daily 1 min chart' # ------------------- def redbar = open > close; def na = double.nan; def bn = barnumber(); def istoday = if GetLastDay() == GetDay() then 1 else 0; # 390 min in a 6.5 hour trading day def daymin = 390; def chartagg = GetAggregationPeriod(); def chartmin = chartagg / (1000 * 60); def chartbars = daymin/chartmin; # get min from start time. calc qty bars so far today def start = 0930; def elapsedmin = (secondsfromTime(start) / 60); def elapsedbars = elapsedmin / chartmin; # ------------------- input show_arrow_when_triggered = yes; input show_trigger_values = no; input max_price_diff_for_match = 0.005; input show_labels = no; input test_show_barnumber_bubbles = no; input test_bubbles1_daily_minutes_barnums = no; # ----------------------------- def vertbubbleoffset = 0.001; addlabel(show_labels, "open price difference max " + max_price_diff_for_match, color.yellow); addlabel(show_labels, "chart min " + chartmin, color.yellow); addlabel(show_labels, "bars / day " + chartbars, color.yellow); # loop thru just the bars during the current day, looking for a price match def x = fold i = 1 to (elapsedbars + 1) with p = 1 while (istoday and (absvalue(open - getvalue(open, i)) > max_price_diff_for_match) ) do i; # ==================================== # adjust the offset def x2 = x + 1; # when loop finds a price match, check if prev bar and current bar are red def redbars = ( (x > 1 and x < elapsedbars) and getvalue(redbar, x2) and redbar); def vertlo = 1 - vertbubbleoffset; addchartbubble(show_trigger_values and redbars, low * vertlo, "bn " + bn + "\nopen " + open + "\noffset " + x2 + "\nprev bn " + getvalue(bn, x2), color.yellow, no); def verthi3 = 1 + (0.3 * vertbubbleoffset); plot z = if show_arrow_when_triggered and redbars then high * verthi3 else na; z.SetPaintingStrategy(PaintingStrategy.arrow_down); z.setlineweight(4); z.setdefaultcolor(color.white); # ------------------------- # test bubbles with barnumber. make 1st one of day white, rest gray def vertlo2 = 1 - (0.3*vertbubbleoffset); addchartbubble(test_show_barnumber_bubbles and elapsedmin == 0, low * vertlo2, bn, color.white, no); addchartbubble(test_show_barnumber_bubbles and elapsedmin > 0, low * vertlo2, bn, color.gray, no); # test bubbles def verthi = 1 + (1 * vertbubbleoffset); addchartbubble(test_bubbles1_daily_minutes_barnums and elapsedmin == 0, (high * verthi), "minutes:" + elapsedmin + "\n" + "barnumber:" + elapsedbars, color.yellow, yes); addchartbubble(test_bubbles1_daily_minutes_barnums and elapsedmin > 0, high * verthi, elapsedmin + "\n" + elapsedbars, color.yellow, yes); #
an image with yellow bubbles with values turned on

image with barnumber bubbles turned on
draw red lines to the prev bar that matches the open

i went over your indicator , it is pretty good.
i have only small issues with the scanning.
Thanks so much for sharing with us.
HI AGAINi didn't test this as a scan, which is why i am posting this as a lower study
here is a lower study. it plots a 1 when a match is found, a previous price matches the current price.
to try this as a scan study, remove the line
declare lower;
Python:# findprevopen_01b_lower # change upper to a lower # to possibly be used in a scanner # disable labels # disable bubbles # convert plots to def. have just 1 plot , 1 or 0 # findprevopen_01 # ------------------- # halcyonguy # 05/24/2021 # ------------------- # upper chart study # during the current day, # when the current candle is moving down, (close < open) # look at previous candles, # search for and find the first match, a down candle with a similar open price. # a price match occurs when both opens are within a max difference, default is 0.005 # # ------------------- # https://usethinkscript.com/threads/open-price-of-red-candle-and-ema-34.6603/ # trying to create scanner criteria # rule 4. has to be # 'The open price of this particular red candle has to be equal to one of the # previous opened price of red candle since the market opened on daily 1 min chart' # ------------------- declare lower; def redbar = open > close; def na = double.nan; def bn = barnumber(); def istoday = if GetLastDay() == GetDay() then 1 else 0; # 390 min in a 6.5 hour trading day def daymin = 390; def chartagg = GetAggregationPeriod(); def chartmin = chartagg / (1000 * 60); def chartbars = daymin/chartmin; # get min from start time. calc qty bars so far today def start = 0930; def elapsedmin = (secondsfromTime(start) / 60); def elapsedbars = elapsedmin / chartmin; # ------------------- input show_arrow_when_triggered = yes; input show_trigger_values = no; input max_price_diff_for_match = 0.005; input show_labels = no; input test_show_barnumber_bubbles = no; input test_bubbles1_daily_minutes_barnums = no; # ----------------------------- def vertbubbleoffset = 0.001; #addlabel(show_labels, "open price difference max " + max_price_diff_for_match, color.yellow); #addlabel(show_labels, "chart min " + chartmin, color.yellow); #addlabel(show_labels, "bars / day " + chartbars, color.yellow); # loop thru just the bars during the current day, looking for a price match def x = fold i = 1 to (elapsedbars + 1) with p = 1 while (istoday and (absvalue(open - getvalue(open, i)) > max_price_diff_for_match) ) do i; # ==================================== # adjust the offset def x2 = x + 1; # when loop finds a price match, check if prev bar and current bar are red def redbars = ( (x > 1 and x < elapsedbars) and getvalue(redbar, x2) and redbar); def vertlo = 1 - vertbubbleoffset; #addchartbubble(show_trigger_values and redbars, low * vertlo, "bn " + bn + "\nopen " + open + "\noffset " + x2 + "\nprev bn " + getvalue(bn, x2), color.yellow, no); def verthi3 = 1 + (0.3 * vertbubbleoffset); #plot z = if show_arrow_when_triggered and redbars then high * verthi3 else na; #z.SetPaintingStrategy(PaintingStrategy.arrow_down); #z.setlineweight(4); #z.setdefaultcolor(color.white); # if a previous price that matches the currect price, is found, plot a 1 plot z = if redbars then 1 else 0; # ------------------------- # test bubbles with barnumber. make 1st one of day white, rest gray def vertlo2 = 1 - (0.3*vertbubbleoffset); #addchartbubble(test_show_barnumber_bubbles and elapsedmin == 0, low * vertlo2, bn, color.white, no); #addchartbubble(test_show_barnumber_bubbles and elapsedmin > 0, low * vertlo2, bn, color.gray, no); # test bubbles def verthi = 1 + (1 * vertbubbleoffset); #addchartbubble(test_bubbles1_daily_minutes_barnums and elapsedmin == 0, (high * verthi), "minutes:" + elapsedmin + "\n" + "barnumber:" + elapsedbars, color.yellow, yes); #addchartbubble(test_bubbles1_daily_minutes_barnums and elapsedmin > 0, high * verthi, elapsedmin + "\n" + elapsedbars, color.yellow, yes); #addchartbubble(yes, low, istoday, color.green,no); #
in the picture, the top chart is the original study, drawing arrows when a match is found.
the lower part is this lower study, plotting 1 when a match is found

What time frame should i set for my scanner?
Thanks so much !!!
i am still looking for script scanner that finds the opening price of red candle that equal to the opening price of another red candle since the market opened, with the time frame of 1 Minute & 5 minuts.
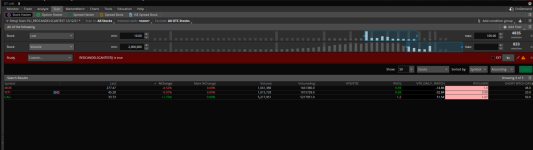
Please see attached picture....the open price of red candle on the right side equal to the opening price of red candle on the left side .
Can anyone help ?
Thanks so much!
- No you don't have to change your time zone
- Can not be used on daily
- set your timeframe to any intraday increment
We can't scan for "the open price of red candle on the right side equal to the opening price of red candle on the left side" as right side -- left side are not adequately defined.
Yell, if you have more questions.
Thanks so much@Daniel
Lastly, you can scan for anything that you can provide a mathematical quantative statement for.
- No you don't have to change your time zone
- Can not be used on daily
- set your timeframe to any intraday increment
We can't scan for "the open price of red candle on the right side equal to the opening price of red candle on the left side" as right side -- left side are not adequately defined.
Yell, if you have more questions.
HAPPY NEW YEAR !
How are you?
My red candel indicator works good.
but above scan does not work really good for me.
can you please let me know what part of the scan i have to copy and paste to my thinkor swim.
i am missing something here.
Thanks so much
Daniel
Please provide:MerryDay!
How are you?
My red candel indicator works good.
but above scan does not work really good for me.
can you please let me know what part of the scan i have to copy and paste to my thinkor swim.
i am missing something here.
Thanks so much
Daniel
- your scan hacker script and
- an image of the scan hacker and results and
- a detail explanation of what "does not work really good"
Unsure of how to upload screenshots to the forum, Here are directions.
looking for Open price of red candle equal to one of the previous open red candle ( 1 min scanner)
# findprevopen_01b_lower

# change upper to a lower
# to possibly be used in a scanner
#  disable labels
#  disable bubbles
#  convert plots to def.  have just 1 plot ,  1 or 0


# findprevopen_01

# -------------------
# halcyonguy
# 05/24/2021
# -------------------
# upper chart study
#  during the current day,
#  when the current candle is moving down, (close < open)
#  look at previous candles,
#  search for and find the first match, a down candle with a similar open price.
#   a price match occurs when both opens are within a max difference, default is 0.005
#
# -------------------
# https://usethinkscript.com/threads/open-price-of-red-candle-and-ema-34.6603/
#  trying to create scanner criteria
#   rule 4. has to be
#    'The open price of this particular red candle has to be equal to one of the
#    previous opened price of red candle since the market opened on daily 1 min chart'
# -------------------

declare lower;

def redbar = open > close;
def na = double.nan;
def bn = barnumber();

def istoday = if GetLastDay() == GetDay() then 1 else 0;

#  390 min in a 6.5 hour trading day
def daymin = 390;
def chartagg = GetAggregationPeriod();
def chartmin = chartagg / (1000 * 60);
def chartbars = daymin/chartmin;

# get min from start time. calc qty bars so far today
def start = 0930;
def elapsedmin = (secondsfromTime(start) / 60);
def elapsedbars = elapsedmin / chartmin;

# -------------------

input show_arrow_when_triggered = yes;
input show_trigger_values = no;

input max_price_diff_for_match = 0.005;
input show_labels = no;

input test_show_barnumber_bubbles = no;
input test_bubbles1_daily_minutes_barnums = no;

# -----------------------------

def vertbubbleoffset = 0.001;

#addlabel(show_labels, "open price difference max " + max_price_diff_for_match, color.yellow);
#addlabel(show_labels, "chart min " + chartmin, color.yellow);
#addlabel(show_labels, "bars / day " + chartbars, color.yellow);

# loop thru just the bars during the current day, looking for a price match
def x = fold  i = 1 to (elapsedbars + 1)
  with p = 1
  while (istoday and (absvalue(open - getvalue(open, i)) > max_price_diff_for_match) )
  do i;

# ====================================

# adjust the offset
def x2 = x + 1;

#  when loop finds a price match, check if prev bar and current bar are red
def redbars = ( (x > 1 and x < elapsedbars) and getvalue(redbar, x2) and redbar);

def vertlo = 1 - vertbubbleoffset;
#addchartbubble(show_trigger_values and redbars, low * vertlo, "bn " + bn + "\nopen " + open + "\noffset " + x2 + "\nprev bn " + getvalue(bn, x2), color.yellow, no);

def verthi3 = 1 + (0.3 * vertbubbleoffset);
#plot z = if  show_arrow_when_triggered and redbars then high * verthi3 else na;
#z.SetPaintingStrategy(PaintingStrategy.arrow_down);
#z.setlineweight(4);
#z.setdefaultcolor(color.white);

# if a previous price that matches the currect price, is found, plot a 1
plot z = if redbars then 1 else 0;

# -------------------------

# test bubbles with barnumber. make 1st one of day white, rest gray
def vertlo2 = 1 - (0.3*vertbubbleoffset);
#addchartbubble(test_show_barnumber_bubbles and elapsedmin == 0, low * vertlo2, bn, color.white, no);
#addchartbubble(test_show_barnumber_bubbles and elapsedmin > 0, low * vertlo2, bn, color.gray, no);

# test bubbles
def verthi = 1 + (1 * vertbubbleoffset);
#addchartbubble(test_bubbles1_daily_minutes_barnums and elapsedmin == 0, (high * verthi), "minutes:" + elapsedmin + "\n" + "barnumber:" + elapsedbars, color.yellow, yes);
#addchartbubble(test_bubbles1_daily_minutes_barnums and elapsedmin > 0, high * verthi, elapsedmin + "\n" + elapsedbars, color.yellow, yes);

#addchartbubble(yes, low, istoday, color.green,no);
#
My scanner show error
Attachments
| Thread starter | Similar threads | Forum | Replies | Date |
|---|---|---|---|---|
| W | DailyATR levels on 1 min chart starting from open price | Questions | 21 | |
| S | Calculating market open price | Questions | 0 | |
| K | Show line with price variation in pre-market and open market | Questions | 0 | |
|
|
Open Range Breakout Price Levels | Questions | 2 | |
|
|
Price is Above or Below the open of candle | Questions | 12 |
Similar threads
Not the exact question you're looking for?
Start a new thread and receive assistance from our community.
Similar threads
Similar threads
The Market Trading Game Changer
- Exclusive indicators
- Proven strategies & setups
- Private Discord community
- ‘Buy The Dip’ signal alerts
- Exclusive members-only content
- Add-ons and resources
- 1 full year of unlimited support
Frequently Asked Questions
useThinkScript is the #1 community of stock market investors using indicators and other tools to power their trading strategies. Traders of all skill levels use our forums to learn about scripting and indicators, help each other, and discover new ways to gain an edge in the markets.
We get it. Our forum can be intimidating, if not overwhelming. With thousands of topics, tens of thousands of posts, our community has created an incredibly deep knowledge base for stock traders. No one can ever exhaust every resource provided on our site.
If you are new, or just looking for guidance, here are some helpful links to get you started.
- The most viewed thread:
https://usethinkscript.com/threads/repainting-trend-reversal-for-thinkorswim.183/ - Our most popular indicator:
https://usethinkscript.com/threads/buy-the-dip-indicator-for-thinkorswim.3553/ - Answers to frequently asked questions:
https://usethinkscript.com/threads/answers-to-commonly-asked-questions.6006/