Oil Break Out Indicator for ThinkorSwim

Ty199

New member
Here is a small and simple Oil Break indicator. It runs off the previous days high and low and add a percentage. But it will break out almost everyday and some times a few times. Get some nice runs on it. But Change it have fun with it and see how you can make it better or just use it as it is. I tried to upload a picture but I cant seem to find out how. But here is the code.

Code:
declare upper;


def y_high = high(period=aggregationperiod.day)[1];
def y_low = low(period=aggregationperiod.day)[1];

def y_range = y_high-y_low;

def d_open = open(period=aggregationPeriod.DAY);

plot upper = d_open+(.25*y_range);

plot lower = d_open-(.25*y_range);

#########
 

Join useThinkScript to post your question to a community of 21,000+ developers and traders.

@Ty199 Have you tried this with ES? Just threw it up on a chart. Simple. Clean. I like it brotha.

wLEsMoH.png
 

Attachments

  • wLEsMoH.png
    wLEsMoH.png
    413.5 KB · Views: 267
Last edited by a moderator:
In case you do not want to add more lines to your chart - below is the code as labels only.

@Ty199 - thank you for sharing!


Code:
##########################################################

def y_high = high(period=aggregationperiod.day)[1];
def y_low = low(period=aggregationperiod.day)[1];

def y_range = y_high-y_low;

def d_open = open(period=aggregationPeriod.DAY);

def upper = d_open+(.25*y_range);
def lower = d_open-(.25*y_range);

def Unb = close <= upper;
def Ub = close crosses above upper;
def Ubip = close > upper;
AddLabel(Unb, "Upper under @ "+upper, Color.GRAY);
AddLabel(Ub, "Upper BREAK @ "+upper, Color.GREEN);
AddLabel(Ubip, "Upper over @ "+upper, Color.DARK_GREEN);

def Lnb = close >= lower;
def Lb = close crosses below lower;
def Lbip = close < lower;
AddLabel(Lnb, "Lower over @ "+lower, Color.GRAY);
AddLabel(Lb, "Lower BREAK @ "+lower, Color.RED);
AddLabel(Lbip, "Lower under @ "+lower, Color.DARK_RED);

###################################################################
 
Last edited:
That will work also and cleans up some space. I usually just set it on another screen with /CL or /QM and watch it when Im on trading. Works pretty good and can make some good gains. Been stetting PT at the closest same break line of the previous 5 days. It will blow right past and keep going almost every time, but its a start of a target price area. @mc01439
 
That will work also and cleans up some space. I usually just set it on another screen with /CL or /QM and watch it when Im on trading. Works pretty good and can make some good gains. Been stetting PT at the closest same break line of the previous 5 days. It will blow right past and keep going almost every time, but its a start of a target price area. @mc01439

@Ty199 - Today on /CL it bounced around the low bar a number of times and the high line seem to act as resistance. Fridays after 11:30 I rarely make a trade on /CL. Only trade for me today was at 10:42. CL stopped right at the low line for the day before bouncing and breaking it for a short time waiting for the 13:00 report.


Not for sure of the percent on it. I forgot what the numbers was for the code. I did not come up with the strategy, I had it coded so it could go on a chart with out adding it up everyday and drawing lines. I will see if I can find the complete strategy.
 
Found it, here is the strategy before being coded.
It is figured like this.
Previous day High 58.70 Previous day Low 53.20
These are now subtracted for the difference which is 5.50
That value is divided by 4 which values at 1.375
Now 1.375 is added to the next day open price (ex. open price is 56.10 + 1.375 = 57.475 )
It is also subtracted from the open price ( ex. open price is 56.10 - 1.375 = 54.725 )
Now you have a high and a low that is calculated automatically and placed on the chart for that day of trading.
High 57.475 Low 54.725
It works pretty good, but can use some changing to what a person likes to trade. The good thing about it is there is not limited to any certain time frame. Use it how ever you want on a time frame. 30 min is decent but 15 also works good.

As @Ty199 outlines - the code comes up with the same number. Again @Ty199 , thanks for sharing.
 
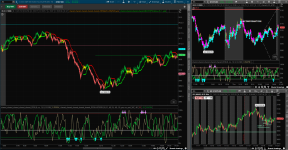
@john3 Are you talking about how the candles run in a green or red pattern ? If so where your studies icon is at the top of your platform it will say "style". Click that and it will drop down, it will give you options of what candle you want. Try the Hienki Ashi candle. It makes it more of a trend style pattern on your candles. It is a good style but does change your candles to what I think to be harder to read the price action and also shows differant candle patterns as the standard ones. Its nice to use to get a familiar style of using some indicators, but for best profit on my case I changed back to standard candles to be more accurate on entries and exits of trades. Hope this helps.
 
@john3 Are you talking about how the candles run in a green or red pattern ? If so where your studies icon is at the top of your platform it will say "style". Click that and it will drop down, it will give you options of what candle you want. Try the Hienki Ashi candle. It makes it more of a trend style pattern on your candles. It is a good style but does change your candles to what I think to be harder to read the price action and also shows differant candle patterns as the standard ones. Its nice to use to get a familiar style of using some indicators, but for best profit on my case I changed back to standard candles to be more accurate on entries and exits of trades. Hope this helps.
I second the inquiry on your candle setup. They're definitely Heiken-Ashi, but it looks like they're painted based upon ParabolicSAR with yellow candles being a neutral area??
 

Similar threads

Not the exact question you're looking for?

Start a new thread and receive assistance from our community.

87k+ Posts
368 Online
Create Post

Similar threads

Similar threads

The Market Trading Game Changer

Join 2,500+ subscribers inside the useThinkScript VIP Membership Club
  • Exclusive indicators
  • Proven strategies & setups
  • Private Discord community
  • ‘Buy The Dip’ signal alerts
  • Exclusive members-only content
  • Add-ons and resources
  • 1 full year of unlimited support

Frequently Asked Questions

What is useThinkScript?

useThinkScript is the #1 community of stock market investors using indicators and other tools to power their trading strategies. Traders of all skill levels use our forums to learn about scripting and indicators, help each other, and discover new ways to gain an edge in the markets.

How do I get started?

We get it. Our forum can be intimidating, if not overwhelming. With thousands of topics, tens of thousands of posts, our community has created an incredibly deep knowledge base for stock traders. No one can ever exhaust every resource provided on our site.

If you are new, or just looking for guidance, here are some helpful links to get you started.

What are the benefits of VIP Membership?
VIP members get exclusive access to these proven and tested premium indicators: Buy the Dip, Advanced Market Moves 2.0, Take Profit, and Volatility Trading Range. In addition, VIP members get access to over 50 VIP-only custom indicators, add-ons, and strategies, private VIP-only forums, private Discord channel to discuss trades and strategies in real-time, customer support, trade alerts, and much more. Learn all about VIP membership here.
How can I access the premium indicators?
To access the premium indicators, which are plug and play ready, sign up for VIP membership here.
Back
Top