Noro's OverCloud provides nice supports and resistances in different timeframes. 
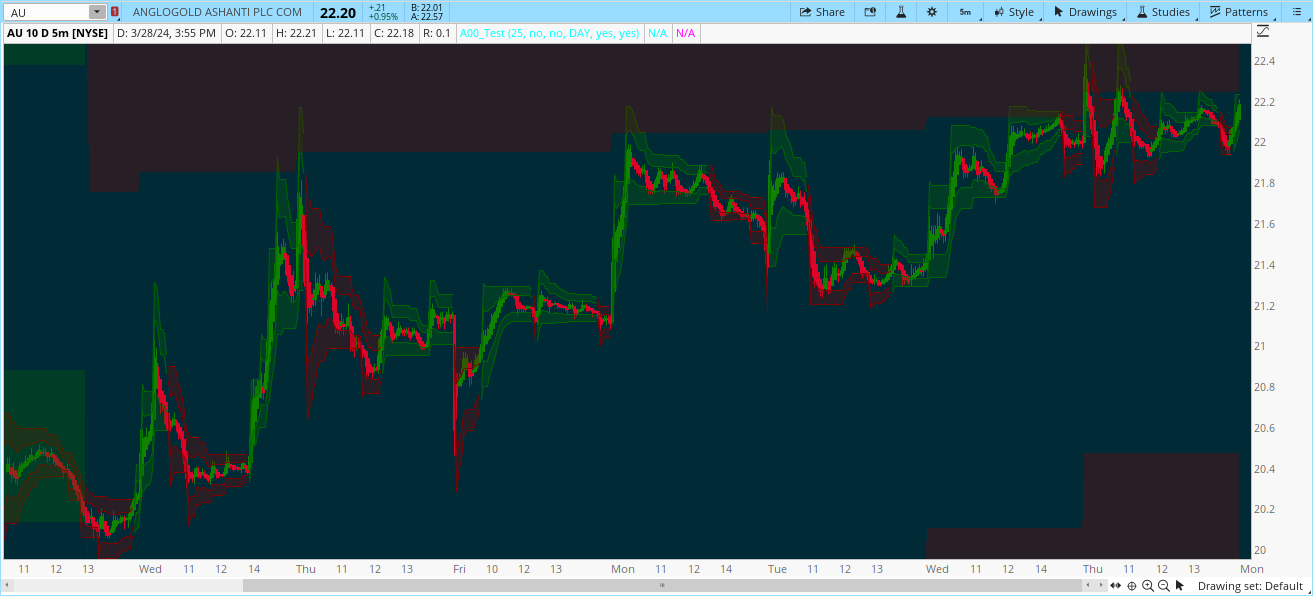
I would like to know how to convert this Pinescript indicator into one by using Thinkscript.
Here is the link of Noro's OverCloud v1.2 MTF:
https://ru.tradingview.com/script/A83HIJSO-noro-s-overcloud-v1-2-mtf/
Here is the content of the indicator. Thank you very much for your help.
//Noro
//2017
//@version=2
study(title = "Noro's OverCloud v1.2 MTF", shorttitle = "OverCloud 1.2", overlay = true)
//Settings
cloud = input(25, defval = 25, minval = 5, maxval = 50, title = "cloud, % of ATR")
needcenter = input(false, defval = false, title = "50%-line")
needcenterbig = input(false, defval = false, title = "50%-line big timeframe")
bigtf = input('D', defval = 'D', title = "big timeframe")
border = input(true, defval = true, title = "need borders?")
trendcolor = input(true, defval = true, title = "need trendcolor?")
//Fast ATR
up = hl2 - (3 * atr(7))
dn = hl2 + (3 * atr(7))
tup = close[1] > tup[1] ? max(up, tup[1]) : up
tdown = close[1] < tdown[1]? min(dn, tdown[1]) : dn
center = (tup + tdown) / 2
limit = (tup - tdown) / 100 * cloud
upcloud = tup - limit
dncloud = tdown + limit
trend = close > tdown[1] ? 1 : close < tup[1]? -1 : nz(trend[1], 1)
centercolor = needcenter == false ? na : blue
bordercolor = border == true ? black : na
cloudcolor = trend == 1 ? lime : red
p11 = plot(tup, color = bordercolor, linewidth = 1, transp = 0, title = "100% ATR")
p12 = plot(tdown, color = bordercolor, linewidth = 1, transp = 0, title = "Upper cloud")
p13 = plot(center, color = centercolor, linewidth = 3, transp = 0, title = "50% ATR")
p14 = plot(upcloud, color = bordercolor, linewidth = 1, transp = 0, title = "Lower cloud")
p15 = plot(dncloud, color = bordercolor, linewidth = 1, transp = 0, title = "0% ATR")
fill(p11, p14, color = trendcolor == false ? lime : cloudcolor, transp = 50)
fill(p12, p15, color = trendcolor == false ? red : cloudcolor, transp = 50)
//Slow ATR
up2 = security(tickerid, bigtf, hl2 - (3 * atr(7)))
dn2 = security(tickerid, bigtf, hl2 + (3 * atr(7)))
tup2 = close[1] > tup2[1] ? max(up2, tup2[1]) : up2
tdown2 = close[1] < tdown2[1]? min(dn2, tdown2[1]) : dn2
center2 = (tup2 + tdown2) / 2
limit2 = (tup2 - tdown2) / 100 * cloud
upcloud2 = tup2 - limit2
dncloud2 = tdown2 + limit2
trend2 = close > tdown2[1] ? 1 : close < tup2[1]? -1 : nz(trend2[1], 1)
centercolor2 = needcenterbig == false ? na : black
bordercolor2 = border == true ? black : na
cloudcolor2 = trend2 == 1 ? lime : red
p21 = plot(tup2, color = bordercolor2, linewidth = 1, transp = 0, title = "100% ATR big TF")
p22 = plot(tdown2, color = bordercolor2, linewidth = 1, transp = 0, title = "Upper cloud big TF")
p23 = plot(center2, color = centercolor2, linewidth = 3, transp = 0, title = "50% ATR big TF")
p24 = plot(upcloud2, color = bordercolor2, linewidth = 1, transp = 0, title = "Lower cloud big TF")
p25 = plot(dncloud2, color = bordercolor2, linewidth = 1, transp = 0, title = "0% ATR big TF")
fill(p21, p24, color = trendcolor == false ? lime : cloudcolor2, transp = 50)
fill(p22, p25, color = trendcolor == false ? red : cloudcolor2, transp = 50)