ThinkScript Portfolio Functions In ThinkOrSwim Are Now Working!

Mark1126

New member
Code:
#Example of Average Entry Price with stops

 # Plotting Average Actual Entry with ATR stops

# Mobius

# 01.01.2018

input AtrMultiplier = 2.00;

input Atr_Length = 5;

input Dir = {default long, short};

 plot hide = double.nan;

     hide.setDefaultColor(Color.Black);

def c = if isNaN(close[-1]) then close else c[1];

def ATR = Average(TrueRange(high, close, low), Atr_Length) * AtrMultiplier;

def Entry = if isNaN(GetAveragePrice())

            then Entry[1]

            else GetAveragePrice();

def LastEntryBar = if Entry != Entry[1]

                   then barNumber()

                   else LastEntryBar[1];

plot Entry_ = if barNumber() >= HighestAll(LastEntryBar) and Entry > 0

              then highestAll(if isNaN(close[-1])

                              then Entry

                              else double.nan)

              else double.nan;

     Entry_.SetStyle(Curve.Long_Dash);

     Entry_.SetLineWeight(3);

     Entry_.SetDefaultColor(CreateColor(255,215,0));

     Entry_.HideBubble();

     Entry_.HideTitle();

def PL = if Entry > 0 then Entry - c else 0;

#AddChartBubble(barNumber() == HighestAll(barNumber()), Entry_, "AVG " + AsDollars(Entry), Entry_.TakeValueColor());

plot stop;

     stop.SetLineWeight(2);

     stop.SetdefaultColor(color.red);

switch (Dir)

{

case long:

    stop = if barNumber() >= HighestAll(LastEntryBar) and Entry > 0

           then highestAll(if isNaN(close[-1])

                           then Entry - ATR

                           else double.nan)

           else double.nan;;

case short:

    stop = if barNumber() >= HighestAll(LastEntryBar) and Entry > 0

           then highestAll(if isNaN(close[-1])

                           then Entry + ATR

                           else double.nan)

           else double.nan;;

}


plot tgt;

     tgt.SetLineWeight(2);

     tgt.SetdefaultColor(color.green);

switch (Dir)

{

case long:

    tgt = if barNumber() >= HighestAll(LastEntryBar) and Entry > 0

           then highestAll(if isNaN(close[-1])

                           then Entry + ATR

                           else double.nan)

           else double.nan;;

case short:

    tgt = if barNumber() >= HighestAll(LastEntryBar) and Entry > 0

           then highestAll(if isNaN(close[-1])

                           then Entry - ATR

                           else double.nan)

           else double.nan;;

}

# End Code
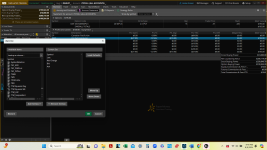
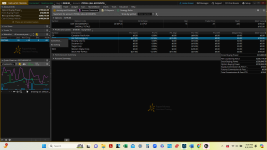
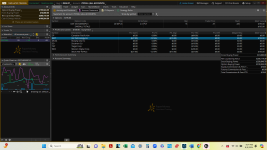
Since moving to Schwab, this plots in paper trading but not live trading. I've recopied the code, compared all parameter settings between paper vs live, but can't figure out what is preventing the average price horizontal line from displaying on chart. Is anyone else having this issue?
 
Solution
It appears that Schwab has resolved the issues with the portfolio functions.
6JhCZ9x.png

https://usethinkscript.com/threads/entries-and-target-for-thinkorswim.10302/#post-91493
Hi, since the merge some of my customs labels not working, I wonder if I am the only one of some of you are experimenting the same issue

this an example of the code thats not working for me

def qty = GetQuantity();
def tp = getaveragePrice();

addlabel (yes, qty, color.white);
addlabel (yes, tp, color.white);

I really appreciate your help
 
Currently, thinkscript portfolio functions are not executing as they should.
I am 'assuming' that this will be a long-term problem.

But this forum has no affiliation with Charles Schwab, so your guess is as good as mine.

@Mark1126 @perroveloz

I have given it plenty of time, hoping that things would begin working correctly again, but my indicator still is not functioning correctly since the switch to Schwab. Very frustrating as it is an integral part of my trading.

This is one indicator I normally only give to students who take my options training course, but I would be happy to send the indicator to anyone who is a more experienced coder to me, and feels they can get it working again properly.

It simply is no longer recognizing the qty or avg functions, which takes away all of the usefulness from the indicator. I can't understand why the functions will no longer work, since they are standard thinkscript functions.

Please let me know if you think you can help or have an idea on what is causing the issue!
 
Last edited by a moderator:
The portfolio variables are non-functioning in ThinkScript since the merger.

Schwab has not integrated their portfolio tracking into ThinkScript.
Currently, we have not been given any sign that they will provide access to this data.
So the forum is currently designating these functions as depreciated.

To read more about this issue and to find the members' favorite portfolio workarounds:
https://usethinkscript.com/threads/...o-functions-in-thinkorswim.18808/#post-142000

@sparhawk
 
Last edited by a moderator:
ThinkScript portfolio functions are not working.
Schwab has stated: This is a known issue.
Schwab has not said whether these script functions will be available going forward.

Members are using two alternatives to track their trades
detaching the monitor tab, set to Activity and Positions
and/or
creating a watchlist

The watchlist can utilize the separate built-in portfolio functions, which do work. But they cannot be edited or customized.

To see all your holdings in a watchlist
1. click on one of the watchlists at the top of the list: All (or Current) Account Positions
bnJKLWy.png


To populate the watchlist with Portfolio Functions
1. click on the gear to the right of your columns
2. click on Portfolio
4xPxd49.png
 
Last edited:
OK. First you mention two solutions; detaching the monitor tab and creating a watchlist. I only see creating a watchlist demonstrated here. The attached screen shots are what I encountered. First only open positions are shown in the watchlist although "All Positions" is selected. On the RH side you can see the Account Statement is pretty much the same. Closed positions are shown but there is only a P/L YTD amount. You can't when you bought or sold the position what the trade price was or what the position was (was it a call or a put?). Second there is no portfolio option under the gear icon and the options that are there do not include portfolio info most notably "trade price". As far as the merger is concerned I was noticing this same issue in 2021 but I was trying to learn options and had other stuff to worry about so I'd figure it out later but evidently..... I know no one on this forum has control over any of this but I have a problem with my trades being recorded in invisible ink. Am I the only one? How can I review how I'm doing if I can't see what I did? That ten ninety whatever they send at the end of the year doesn't help either it's too late and it may as well be written in Chinese. And yes the screen shots are from the Paper Money account but the Live Account is the same only worse, "All Positions" is not even and option there. I was looking at Schwab's YT channel "Trader" last night and I saw some related stuff on there. Maybe I can get some answers there.
 

Attachments

  • Customize Items Available.png
    Customize Items Available.png
    247.5 KB · Views: 39
  • Gear icon choices.png
    Gear icon choices.png
    245.2 KB · Views: 41
  • Watchlist.png
    Watchlist.png
    243.9 KB · Views: 39
OK. First you mention two solutions; detaching the monitor tab and creating a watchlist. I only see creating a watchlist demonstrated here. The attached screen shots are what I encountered. First only open positions are shown in the watchlist although "All Positions" is selected. On the RH side you can see the Account Statement is pretty much the same. Closed positions are shown but there is only a P/L YTD amount. You can't when you bought or sold the position what the trade price was or what the position was (was it a call or a put?). Second there is no portfolio option under the gear icon and the options that are there do not include portfolio info most notably "trade price". As far as the merger is concerned I was noticing this same issue in 2021 but I was trying to learn options and had other stuff to worry about so I'd figure it out later but evidently..... I know no one on this forum has control over any of this but I have a problem with my trades being recorded in invisible ink. Am I the only one? How can I review how I'm doing if I can't see what I did? That ten ninety whatever they send at the end of the year doesn't help either it's too late and it may as well be written in Chinese. And yes the screen shots are from the Paper Money account but the Live Account is the same only worse, "All Positions" is not even and option there. I was looking at Schwab's YT channel "Trader" last night and I saw some related stuff on there. Maybe I can get some answers there.

Anything on youtube that claims to provide a solution must be old.
The custom scripting portfolio functions have been depreciated since the Schwab final integration of
May 31, 2024.

They don't exist anymore, therefore no custom scripting workarounds.
Make sure that you are placing a complaint with Schwab.
This is a critical need for users of ToS.
 
FYI I did notice while watching a YT video that there is a "days back" button on Account History sub tab that let's you go back up to 370 days. But the default is 1 day so normally stuff just vanishes after 2 days if you don't adjust? Also it seems you can download the info so that's all good. But for some reason that button is non functional in Paper Money. That ****s.
 

Join useThinkScript to post your question to a community of 21,000+ developers and traders.

Similar threads

Not the exact question you're looking for?

Start a new thread and receive assistance from our community.

87k+ Posts
418 Online
Create Post

Similar threads

Similar threads

The Market Trading Game Changer

Join 2,500+ subscribers inside the useThinkScript VIP Membership Club
  • Exclusive indicators
  • Proven strategies & setups
  • Private Discord community
  • ‘Buy The Dip’ signal alerts
  • Exclusive members-only content
  • Add-ons and resources
  • 1 full year of unlimited support

Frequently Asked Questions

What is useThinkScript?

useThinkScript is the #1 community of stock market investors using indicators and other tools to power their trading strategies. Traders of all skill levels use our forums to learn about scripting and indicators, help each other, and discover new ways to gain an edge in the markets.

How do I get started?

We get it. Our forum can be intimidating, if not overwhelming. With thousands of topics, tens of thousands of posts, our community has created an incredibly deep knowledge base for stock traders. No one can ever exhaust every resource provided on our site.

If you are new, or just looking for guidance, here are some helpful links to get you started.

What are the benefits of VIP Membership?
VIP members get exclusive access to these proven and tested premium indicators: Buy the Dip, Advanced Market Moves 2.0, Take Profit, and Volatility Trading Range. In addition, VIP members get access to over 50 VIP-only custom indicators, add-ons, and strategies, private VIP-only forums, private Discord channel to discuss trades and strategies in real-time, customer support, trade alerts, and much more. Learn all about VIP membership here.
How can I access the premium indicators?
To access the premium indicators, which are plug and play ready, sign up for VIP membership here.
Back
Top