
Dear ThinkScript community,
I am new with ThinkScript, I need your help.
I have modified the Thinkscript developped by @halcyonguy in order to plot an arrow on the chart when a buy signal or a sell signal is triggered. The code is given below, it works very well:
I would like to add an arrow when a stopsellsignal or a stopbuysignal is triggered.
The stopsellsignal is defined as follows:
- if a sell signal is in progress, stopsellsignal is trigerred either if low <= LowerBand_PC or if close >= high[2]. In that case an arrow up is plotted at the low of the current candle. Only the first arrow is plotted based on the first stop signal triggered.
The stopbuysignal is defined as follows:
- if a buy signal is in progress, stopbuysignal is trigerred either if high >= UpperBand_PC or if close <= low[2]. In that case an arrow down is plotted at the high of the current candle. Only the first arrow is plotted based on the first stop signal triggered.
- when a stop signal is triggered, the bur / sell sigal is no more active
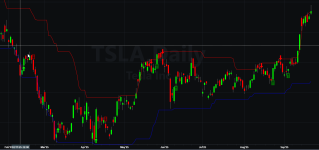
In the attached chart, the green and red arrows are buy and sell signals. This is ok, it works well.
The dark green and dark red arrows are the stopsellsignal and the stopbuysignal. This is my problem, I would like some help to modified my script in order to plot theses stop arrows.
Many thanks in advance for your help.
Bruno
I am new with ThinkScript, I need your help.
I have modified the Thinkscript developped by @halcyonguy in order to plot an arrow on the chart when a buy signal or a sell signal is triggered. The code is given below, it works very well:
I would like to add an arrow when a stopsellsignal or a stopbuysignal is triggered.
The stopsellsignal is defined as follows:
- if a sell signal is in progress, stopsellsignal is trigerred either if low <= LowerBand_PC or if close >= high[2]. In that case an arrow up is plotted at the low of the current candle. Only the first arrow is plotted based on the first stop signal triggered.
The stopbuysignal is defined as follows:
- if a buy signal is in progress, stopbuysignal is trigerred either if high >= UpperBand_PC or if close <= low[2]. In that case an arrow down is plotted at the high of the current candle. Only the first arrow is plotted based on the first stop signal triggered.
- when a stop signal is triggered, the bur / sell sigal is no more active
In the attached chart, the green and red arrows are buy and sell signals. This is ok, it works well.
The dark green and dark red arrows are the stopsellsignal and the stopbuysignal. This is my problem, I would like some help to modified my script in order to plot theses stop arrows.
Many thanks in advance for your help.
Bruno
Code:
declare upper;

#INPUTS
input PriceChannel_Period = 21; #Length for the Price Chanbbel calculation
input Long_Short_SignalSize = 2; # Size of the Sell and Buy arrows
input Stop_SignalSize = 1; # Size of the arrows for stops
input Plot_Price_Chanel = yes; #plots the Price Channel
input Show_Stop_Signals = yes; #plots the stop signals

#Price Channel calculation
def LowerBand_PC = Lowest(low[1], PriceChannel_Period);
def UpperBand_PC = Highest(high[1], PriceChannel_Period);

#Price Channel High Breakout - Sell Signal

def highBar = high >= UpperBand_PC;

def LOHB = if highBar then low else LOHB[1];
def closedBelowLOHB = if highBar then 0 else if close < LOHB then closedBelowLOHB[1] + 1 else closedBelowLOHB[1];

def SellSignal = closedBelowLOHB == 1 and closedBelowLOHB[1] == 0;

#Price Channel Low Breakout - Buy Signal
def lowBar = low <= LowerBand_PC;

def HOLB = if lowBar then high else HOLB[1];
def closedAboveHOLB = if lowBar then 0 else if close > HOLB then closedAboveHOLB[1] + 1 else closedAboveHOLB[1];

def BuySignal = closedAboveHOLB == 1 and closedAboveHOLB[1] == 0;

#Short arrow signal - HOLB_LOHB Breakout
plot SellArrow = if SellSignal then high + 2 * TickSize() else Double.NaN;

SellArrow.SetPaintingStrategy(PaintingStrategy.ARROW_DOWN);
SellArrow.SetDefaultColor(Color.RED);
SellArrow.SetLineWeight(Long_Short_SignalSize);

#Long arrow signal - HOLB_LOHB Breakout
plot BuyArrow = if BuySignal then low - 2 * TickSize() else Double.NaN;

BuyArrow.SetPaintingStrategy(PaintingStrategy.ARROW_UP);
BuyArrow.SetDefaultColor(Color.GREEN);
BuyArrow.SetLineWeight(Long_Short_SignalSize);

#Plots Price Channel bands
plot PriceChannelUpperBand = if Plot_Price_Chanel then UpperBand_PC else Double.NaN;

PriceChannelUpperBand.SetPaintingStrategy(PaintingStrategy.LINE);
PriceChannelUpperBand.SetDefaultColor(Color.DARK_RED);
PriceChannelUpperBand.SetLineWeight(Long_Short_SignalSize);
PriceChannelUpperBand.SetStyle(Curve.FIRM);

plot PriceChannelLowerBand = if Plot_Price_Chanel then LowerBand_PC else Double.NaN;

PriceChannelLowerBand.SetPaintingStrategy(PaintingStrategy.LINE);
PriceChannelLowerBand.SetDefaultColor(Color.DARK_GREEN);
PriceChannelLowerBand.SetLineWeight(Long_Short_SignalSize);
PriceChannelLowerBand.SetStyle(Curve.FIRM);

# END
Attachments
Last edited by a moderator: