Need Help to develop a tick indicator for MAG7 stocks

BETrader

New member
Plus
Dear Thinkscript community,

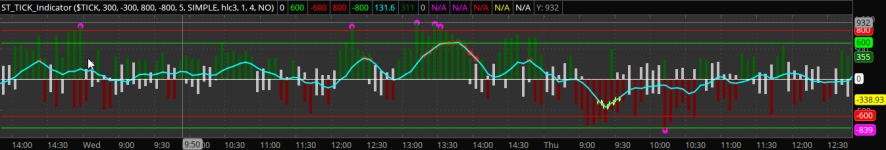
I have developped this script for ticks (based on same indicator developped by simpler trading):


I would like to modify this code to have the same thing with the MAG7 stocks: AAPL, AMZN, GOOGL, META, MSFT, NVDA, TSLA. Could you please help me ? I am a newbie with Thinkscript !
Many thanks in advance for your help

Code:
declare lower;
input TICK_Symbol = {default "$TICK", "$TICKC", "$TIKSP", "$TIKSPC", "$TIKND", "$TICKC/Q", "$TIKNDC", "$TICK/Q", "$TIKRL", "$TIKI", "$TIKA", "$TICKAC", "$TICKAR", "$TICKARC", "$TIKIC", "$TIKRLC", "$TIKUS", "$TIKUSC"};
input SMA_High_extreme = 300; #Limit High for SMA Ticks - Overbought
input SMA_Low_extreme = -300; #Limit Low for SMA Ticks - Oversold
input TICK_High_extreme = 800; #Limit High for Ticks - Overbought
input TICK_Low_extreme = -800; #Limit Low for Ticks - Oversold.
input Moving_Average_Length = 5; #Moving Average Length
input Moving_Average_Type = AverageType.SIMPLE;
input Average_Price = {default hlc3, close};
input TICK_Histogram_Size = 1;
input TICK_Points_Size = 4;
input Show_TICK_close = {default "NO", "YES"};

#Ticks Colors
DefineGlobalColor("QuietTicks", Color.LIGHT_GRAY);
DefineGlobalColor("TickAverage", Color.CYAN);
DefineGlobalColor("TickHighBars", Color.DARK_GREEN);
DefineGlobalColor("TickTurbo", Color.Magenta);
DefineGlobalColor("TickLowBars", Color.DARK_RED);
DefineGlobalColor("TickAverageHighExtreme", Color.RED);
DefineGlobalColor("TickAverageLowExtreme", Color.YELLOW);
DefineGlobalColor("TickClose", Color.WHITE);

def tickdata;

switch (Average_Price) {
case hlc3:
tickdata = hlc3(TICK_Symbol);
case close:
tickdata = close(TICK_Symbol);
}

def Moving_Average = MovingAverage(Moving_Average_Type, tickdata, Moving_Average_Length);

#Plots 0 line (style = line)
plot ZeroLine = 0;

ZeroLine.SetPaintingStrategy(PaintingStrategy.HORIZONTAL);
ZeroLine.SetLineWeight(1);
ZeroLine.SetDefaultColor(Color.WHITE);
ZeroLine.SetStyle(Curve.FIRM);

#Plots Up limit for $TICK (+600) (style = line)
plot TICKLimitUP = 600;

TICKLimitUP.SetPaintingStrategy(PaintingStrategy.HORIZONTAL);
TICKLimitUP.SetLineWeight(1);
TICKLimitUP.SetDefaultColor(Color.GREEN);
TICKLimitUP.SetStyle(Curve.FIRM);

#Plots Down limit for $TICK (-600) (style = line)
plot TICKLimitDN = -600;

TICKLimitDN.SetPaintingStrategy(PaintingStrategy.HORIZONTAL);
TICKLimitDN.SetLineWeight(1);
TICKLimitDN.SetDefaultColor(Color.RED);
TICKLimitDN.SetStyle(Curve.FIRM);

#Plots Medium limit Up for $TICK (+800) (style = line)
plot TICKLimitMediumUP = 800;

TICKLimitMediumUP.SetPaintingStrategy(PaintingStrategy.HORIZONTAL);
TICKLimitMediumUP.SetLineWeight(1);
TICKLimitMediumUP.SetDefaultColor(Color.RED);
TICKLimitMediumUP.SetStyle(Curve.FIRM);

#Plots Medium limit Down for $TICK (-800) (style = line)
plot TICKLimitMediumDN = -800;

TICKLimitMediumDN.SetPaintingStrategy(PaintingStrategy.HORIZONTAL);
TICKLimitMediumDN.SetLineWeight(1);
TICKLimitMediumDN.SetDefaultColor(Color.GREEN);
TICKLimitMediumDN.SetStyle(Curve.FIRM);

#Plots Moving Average (style = line)
#plot MovingAverage = if !IsNaN(Moving_Average) then Moving_Average else Double.NaN;
plot TickAverage = if !IsNaN(Moving_Average) then Moving_Average else Double.NaN;

TickAverage.SetPaintingStrategy(PaintingStrategy.LINE);
TickAverage.SetLineWeight(2);
TickAverage.SetDefaultColor(Color.CYAN);
TickAverage.SetStyle(Curve.FIRM);

#Plots High of $TICK (style = histogram)
plot TickHigh = if high(TICK_Symbol) >= 0 then high(TICK_Symbol) else 0;

TickHigh.SetPaintingStrategy(PaintingStrategy.HISTOGRAM);
TickHigh.AssignValueColor(if high(TICK_Symbol) >= SMA_High_extreme then GlobalColor("TickHighBars") else GlobalColor("QuietTicks"));
TickHigh.SetLineWeight(TICK_Histogram_Size);

#Plots Low of $TICK (style = histogram)
plot TickLow = if low(TICK_Symbol) <= 0 then low(TICK_Symbol) else 0;

TickLow.SetPaintingStrategy(PaintingStrategy.HISTOGRAM);
TickLow.AssignValueColor(if low(TICK_Symbol) <= SMA_Low_extreme then GlobalColor("TickLowBars") else GlobalColor("QuietTicks"));
TickLow.SetLineWeight(TICK_Histogram_Size);

#Plots High Max of $TICK (style = point) if High Max >= TICK_High_extreme
plot TickHighExtreme = if high(TICK_Symbol) >= TICK_High_extreme then high(TICK_Symbol) else Double.NaN;

TickHighExtreme.SetPaintingStrategy(PaintingStrategy.LINE_VS_POINTS);
TickHighExtreme.SetLineWeight(TICK_Points_Size);
TickHighExtreme.SetDefaultColor(GlobalColor("TickTurbo"));

#Plots Low Max of $TICK (style = point) if Low Min <= TICK_Low_extreme
plot TickLowExtreme = if low(TICK_Symbol) <= TICK_Low_extreme then low(TICK_Symbol) else Double.NaN;

TickLowExtreme.SetPaintingStrategy(PaintingStrategy.LINE_VS_POINTS);
TickLowExtreme.SetLineWeight(TICK_Points_Size);
TickLowExtreme.SetDefaultColor(GlobalColor("TickTurbo"));

#Plots High Max of SMA (style = point) if Moving_Average >= SMA_High_extreme
plot MovingAveragehigh_extreme = if Moving_Average >= SMA_High_extreme then Moving_Average else Double.NaN;

MovingAveragehigh_extreme.SetPaintingStrategy(PaintingStrategy.LINE_VS_POINTS);
MovingAveragehigh_extreme.SetLineWeight(TICK_Points_Size);
MovingAveragehigh_extreme.SetDefaultColor(GlobalColor("TickAverageHighExtreme"));

#Plots Low Min of $TICK (style = point) if Moving_Average <= SMA_Low_extreme
plot MovingAveragelow_extreme = if Moving_Average <= SMA_Low_extreme then Moving_Average else Double.NaN;

MovingAveragelow_extreme.SetPaintingStrategy(PaintingStrategy.LINE_VS_POINTS);
MovingAveragelow_extreme.SetLineWeight(TICK_Points_Size);
MovingAveragelow_extreme.SetDefaultColor(GlobalColor("TickAverageLowExtreme"));

#Plots $TICK close
plot TICKclose = if Show_TICK_close and !IsNaN(close(TICK_Symbol)) then close(TICK_Symbol) else Double.NaN;

TICKclose.SetPaintingStrategy(PaintingStrategy.POINTS);
TICKclose.SetLineWeight(1);
TICKclose.SetDefaultColor(GlobalColor("TickClose"));

#END
 

Attachments

  • Ticks.png
    Ticks.png
    42.2 KB · Views: 184
Last edited by a moderator:
Solution
Individual stocks and the Mag7 do not have TICKs.
Code:
# TICK
# Symbol  | Symbol
# Primary | Composite | Description
# $TIKI   # $TIKIC    | DJIA TICK
# $TIKND  # $TIKNDC   | NASDAQ 100 TICK
# $TIKSP  # $TIKSPC   | SNP 500 TICK
# $TIKRL  # $TIKRLC   | RUSSELL 2000 TICK
# $TIKUS  # $TIKUSC   | AllUSA TICK
# $TICK/Q # $TICK/QC  | NASDAQ TICK
# $TICK   # $TICKC    | NYSE TICK
 
Solution
Individual stocks and the Mag7 do not have TICKs.
Code:
# TICK
# Symbol  | Symbol
# Primary | Composite | Description
# $TIKI   # $TIKIC    | DJIA TICK
# $TIKND  # $TIKNDC   | NASDAQ 100 TICK
# $TIKSP  # $TIKSPC   | SNP 500 TICK
# $TIKRL  # $TIKRLC   | RUSSELL 2000 TICK
# $TIKUS  # $TIKUSC   | AllUSA TICK
# $TICK/Q # $TICK/QC  | NASDAQ TICK
# $TICK   # $TICKC    | NYSE TICK
Hi @Carl-not-Karl,
Thank you very much for your reply. I know that Individual stocks and the Mag7 do not have TICKs, that is my problem. But is there a way to simulate the ticks, using as an example the buy/sell volume pressure, or counting the number of trades up vs the number of trades down for a given stock ?
You will find enclosed an example from simpler trading.
 

Attachments

  • MAG7_ticks.png
    MAG7_ticks.png
    144.4 KB · Views: 99
Last edited:
Code:
# ======================================================
# ST_TICK_vs_MAG7_Cumulative  (Fixed Shading Settings) v5
# ======================================================
# Shading rules are FIXED (no inputs):
# - RTH only 09:30–16:00 ET
# - Bias lock: first 60 minutes (no shading)
# - Thresholds:  $TICK ±600,  MAG7 ±200
# - Confirm: 2 consecutive bars
# - Smoothing: SMA(3) on cumulative lines
# Includes bottom color strip and scaled histogram for visibility.
# ======================================================

declare lower;

# --------- Minimal inputs (shading settings are fixed) ---------
input tickSymbol = "$TICK";
input showRawTick = yes;
input showRawMag7 = yes;

# --------- Constants (DO NOT CHANGE) ---------
def TICK_POS = 600;
def TICK_NEG = -600;
def MAG_POS  = 200;
def MAG_NEG  = -200;
def CONFIRM  = 2;
def SMOOTH   = 3;
def OPEN_WINDOW_MIN = 60;
def SHADE_ON = yes;

# --------- Data pulls ---------
def t_raw = close(symbol = tickSymbol);
def T = if !IsNaN(t_raw) then t_raw else close;

def aapl = close(symbol = "AAPL");
def msft = close(symbol = "MSFT");
def nvda = close(symbol = "NVDA");
def amzn = close(symbol = "AMZN");
def googl = close(symbol = "GOOGL");
def meta = close(symbol = "META");
def tsla = close(symbol = "TSLA");

def s1 = Sign(aapl - aapl[1]);
def s2 = Sign(msft - msft[1]);
def s3 = Sign(nvda - nvda[1]);
def s4 = Sign(amzn - amzn[1]);
def s5 = Sign(googl - googl[1]);
def s6 = Sign(meta - meta[1]);
def s7 = Sign(tsla - tsla[1]);

# MAG7 uptick/downtick proxy scaled to TICK-like range
def MAG7raw = 150 * (s1 + s2 + s3 + s4 + s5 + s6 + s7);  # approx [-1050..+1050]

# --------- Time gates: RTH + bias lock ---------
def isRTH        = SecondsFromTime(0930) >= 0 and SecondsTillTime(1600) > 0;
def sessionStart = isRTH and !isRTH[1];
def minutesFromOpen = if isRTH then SecondsFromTime(0930) / 60 else Double.NaN;
def inOpenWindow    = isRTH and minutesFromOpen < OPEN_WINDOW_MIN;
def evalNow         = isRTH and !inOpenWindow;

# --------- Cumulative lines (reset each RTH session) ---------
def cumTickRaw = CompoundValue(1,
                    if sessionStart then T
                    else if isRTH then cumTickRaw[1] + T
                    else cumTickRaw[1],
                  T);

def cumMag7Raw = CompoundValue(1,
                    if sessionStart then MAG7raw
                    else if isRTH then cumMag7Raw[1] + MAG7raw
                    else cumMag7Raw[1],
                  MAG7raw);

def CumTick = if SMOOTH > 0 then Average(cumTickRaw, SMOOTH) else cumTickRaw;
def CumMag7 = if SMOOTH > 0 then Average(cumMag7Raw, SMOOTH) else cumMag7Raw;

# --------- Plots (lines & guides) ---------
plot Zero = 0;
Zero.SetDefaultColor(Color.GRAY);

plot pCumTick = CumTick;
pCumTick.SetDefaultColor(Color.CYAN);
pCumTick.SetLineWeight(2);

plot pCumMag7 = CumMag7;
pCumMag7.SetDefaultColor(Color.MAGENTA);
pCumMag7.SetLineWeight(2);

plot pRawTick = if showRawTick then T else Double.NaN;
pRawTick.SetDefaultColor(Color.LIGHT_GRAY);

plot pRawMag7 = if showRawMag7 then MAG7raw else Double.NaN;
pRawMag7.SetDefaultColor(Color.DARK_GRAY);

plot TickPos = if showRawTick then TICK_POS else Double.NaN;
TickPos.SetDefaultColor(Color.DARK_GREEN);
TickPos.SetStyle(Curve.SHORT_DASH);

plot TickNeg = if showRawTick then TICK_NEG else Double.NaN;
TickNeg.SetDefaultColor(Color.DARK_RED);
TickNeg.SetStyle(Curve.SHORT_DASH);

plot MagPos = if showRawMag7 then MAG_POS else Double.NaN;
MagPos.SetDefaultColor(Color.GREEN);
MagPos.SetStyle(Curve.SHORT_DASH);

plot MagNeg = if showRawMag7 then MAG_NEG else Double.NaN;
MagNeg.SetDefaultColor(Color.RED);
MagNeg.SetStyle(Curve.SHORT_DASH);

# --------- Sync / Divergence logic (FIXED thresholds) ---------
def syncBullNow = T >= TICK_POS and MAG7raw >= MAG_POS;
def syncBearNow = T <= TICK_NEG and MAG7raw <= MAG_NEG;
def divUpNow    = T >= TICK_POS and MAG7raw <= MAG_NEG;  # breadth +, leaders -
def divDownNow  = T <= TICK_NEG and MAG7raw >= MAG_POS;  # breadth -, leaders +

# Confirm by consecutive bars, only after bias lock window
def bullCount = CompoundValue(1,
                  if sessionStart then 0
                  else if evalNow and syncBullNow then bullCount[1] + 1
                  else if !evalNow then 0 else 0, 0);
def bearCount = CompoundValue(1,
                  if sessionStart then 0
                  else if evalNow and syncBearNow then bearCount[1] + 1
                  else if !evalNow then 0 else 0, 0);
def divUpCount = CompoundValue(1,
                  if sessionStart then 0
                  else if evalNow and divUpNow then divUpCount[1] + 1
                  else if !evalNow then 0 else 0, 0);
def divDnCount = CompoundValue(1,
                  if sessionStart then 0
                  else if evalNow and divDownNow then divDnCount[1] + 1
                  else if !evalNow then 0 else 0, 0);

def syncBull = bullCount >= CONFIRM;
def syncBear = bearCount >= CONFIRM;
def divUp    = divUpCount >= CONFIRM;
def divDown  = divDnCount >= CONFIRM;

# --------- Background shading (fixed on) ---------
plot SyncBullTop = if SHADE_ON and evalNow and syncBull then  1 else Double.NaN;
plot SyncBullBot = if SHADE_ON and evalNow and syncBull then  0 else Double.NaN;
SyncBullTop.Hide(); SyncBullBot.Hide();
AddCloud(SyncBullTop, SyncBullBot, Color.DARK_GREEN, Color.DARK_GREEN);

plot SyncBearTop = if SHADE_ON and evalNow and syncBear then  1 else Double.NaN;
plot SyncBearBot = if SHADE_ON and evalNow and syncBear then  0 else Double.NaN;
SyncBearTop.Hide(); SyncBearBot.Hide();
AddCloud(SyncBearTop, SyncBearBot, Color.DARK_RED, Color.DARK_RED);

plot DivTop = if SHADE_ON and evalNow and (divUp or divDown) then 1 else Double.NaN;
plot DivBot = if SHADE_ON and evalNow and (divUp or divDown) then 0 else Double.NaN;
DivTop.Hide(); DivBot.Hide();
AddCloud(DivTop, DivBot, Color.DARK_ORANGE, Color.DARK_ORANGE);

# --------- State histogram (scaled so you can see it) ---------
def stateRaw = if !evalNow then Double.NaN
               else if syncBull then  1
               else if syncBear then -1
               else if (divUp or divDown) then 0
               else 0;

# scale histogram to pane range so it’s visible
def paneTop = HighestAll(Max(pCumTick, pCumMag7));
def paneBot = LowestAll(Min(pCumTick, pCumMag7));
def paneRange = Max(1, paneTop - paneBot);
def histScale = 0.06 * paneRange;  # ~6% of pane height

plot StateHist = if IsNaN(stateRaw) then Double.NaN else stateRaw * histScale;
StateHist.SetPaintingStrategy(PaintingStrategy.HISTOGRAM);
StateHist.SetLineWeight(5);
StateHist.AssignValueColor(
    if syncBull then Color.GREEN
    else if syncBear then Color.RED
    else if (divUp or divDown) then Color.ORANGE
    else Color.DARK_GRAY
);

# --------- Labels ---------
AddLabel(yes,
    "$TICK " + AsText(Round(T, 0)) + " | MAG7 " + AsText(Round(MAG7raw, 0)),
    Color.WHITE);
AddLabel(inOpenWindow, "Bias lock active: evaluating AFTER " + OPEN_WINDOW_MIN + "m", Color.YELLOW);
AddLabel(evalNow and syncBull, "SYNC: BULL (2 bars, +600/+200)", Color.GREEN);
AddLabel(evalNow and syncBear, "SYNC: BEAR (2 bars, -600/-200)", Color.RED);
AddLabel(evalNow and (divUp or divDown), "DIVERGENCE (2 bars)", Color.ORANGE);

What the lines are


  • Cyan = Cumulative $TICK → breadth pressure across NYSE (net buyers vs sellers through the day).
  • Magenta = “MAG7 proxy” → whether AAPL, MSFT, NVDA, AMZN, GOOGL, META, TSLA are moving together up or down bar-to-bar.

Best signals


  1. SYNC BULL (trend-up context)
    • Cyan rising and Magenta rising (ideally both above zero).
    • Raw $TICK prints cluster ≥ +600.
    • Trade: buy pullbacks to VWAP / opening-range high; hold while cyan slope stays up and magenta doesn’t roll.
  2. SYNC BEAR (trend-down context)
    • Both falling (ideally below zero).
    • $TICK clusters ≤ –600.
    • Trade: fade bounces into VWAP / ORB low retests.
  3. DIVERGENCE (chop/rotation risk)
    • Cyan↑, Magenta↓ → breadth strong but leaders weak (rotation into non-mega).
    • Cyan↓, Magenta↑ → top-heavy; index can float but is fragile.
    • Trade: reduce size, take faster targets, or wait for re-sync.

Exits / invalidation


  • State flips (sync bull→divergence or bear), or cyan loses slope and raw $TICK stops printing extremes.
  • Price loses VWAP/ORB against your direction and magenta turns opposite.
(Sorry, I am having trouble inputting code and comments in same reply).
  • +1 if the last bar closed above the prior bar (an “uptick proxy”)
  • –1 if below (a “downtick proxy”)
  • 0 if unchanged

Then it sums those 7 signs and multiplies by a scale (150) so the range is similar to NYSE $TICK:
 

Attachments

  • usethinkscript ticks.png
    usethinkscript ticks.png
    493.8 KB · Views: 147
What the lines are


  • Cyan = Cumulative $TICK → breadth pressure across NYSE (net buyers vs sellers through the day).
  • Magenta = “MAG7 proxy” → whether AAPL, MSFT, NVDA, AMZN, GOOGL, META, TSLA are moving together up or down bar-to-bar.

Best signals


  1. SYNC BULL (trend-up context)
    • Cyan rising and Magenta rising (ideally both above zero).
    • Raw $TICK prints cluster ≥ +600.
    • Trade: buy pullbacks to VWAP / opening-range high; hold while cyan slope stays up and magenta doesn’t roll.
  2. SYNC BEAR (trend-down context)
    • Both falling (ideally below zero).
    • $TICK clusters ≤ –600.
    • Trade: fade bounces into VWAP / ORB low retests.
  3. DIVERGENCE (chop/rotation risk)
    • Cyan↑, Magenta↓ → breadth strong but leaders weak (rotation into non-mega).
    • Cyan↓, Magenta↑ → top-heavy; index can float but is fragile.
    • Trade: reduce size, take faster targets, or wait for re-sync.

Exits / invalidation


  • State flips (sync bull→divergence or bear), or cyan loses slope and raw $TICK stops printing extremes.
  • Price loses VWAP/ORB against your direction and magenta turns opposite.
(Sorry, I am having trouble inputting code and comments in same reply).
  • +1 if the last bar closed above the prior bar (an “uptick proxy”)
  • –1 if below (a “downtick proxy”)
  • 0 if unchanged

Then it sums those 7 signs and multiplies by a scale (150) so the range is similar to NYSE $TICK:
Hi @snow22
Thank you so much for your script. I really appreciate your efficient help. I will try your code.
 
I find it easier to interpret if the Cumulative Ticks and Mag7 are in separate lower windows.
Code:
# =========================================
# CUM_TICK_ChatGPT  (session-reset, continuous)
# Cyan = cumulative $TICK (SMA smoothed)
# =========================================
declare lower;

input tickSymbol  = "$TICK";
input smoothLen   = 3;        # 0 = no smoothing
input showRawTick = yes;

# --- pull $TICK; show warning if missing ---
def t_raw   = close(symbol = tickSymbol);
def hasTick = !IsNaN(t_raw);
AddLabel(!hasTick, "NO $TICK FEED — open $TICK or enable market internals", Color.RED);

# --- RTH session gates ---
def isRTH        = SecondsFromTime(0930) >= 0 and SecondsTillTime(1600) > 0;
def sessionStart = isRTH and !isRTH[1];

# --- cumulative (continuous display) ---
def cumTickRaw = CompoundValue(1,
    if sessionStart then (if hasTick then t_raw else 0)
    else if hasTick then cumTickRaw[1] + t_raw
    else cumTickRaw[1],
    0);

def CumTick = if smoothLen > 0 then Average(cumTickRaw, smoothLen) else cumTickRaw;

# --- plots ---
plot Zero = 0; Zero.SetDefaultColor(Color.GRAY);
plot pCumTick = CumTick; pCumTick.SetDefaultColor(Color.CYAN); pCumTick.SetLineWeight(2);

plot pRawTick = if showRawTick and hasTick then t_raw else Double.NaN;
pRawTick.SetDefaultColor(Color.LIGHT_GRAY);

# --- label ---
AddLabel(yes, "$TICK " + AsText(Round(t_raw, 0)), Color.WHITE);
Code:
# =========================================
# CUM_MAG7_ChatGPT  (session-reset, continuous)
# Magenta = cumulative MAG7 proxy (AAPL, MSFT, NVDA, AMZN, GOOGL, META, TSLA)
# =========================================
declare lower;

input smoothLen    = 3;     # 0 = no smoothing
input showRawMAG7  = yes;
input scalePerName = 150;   # keeps range similar to $TICK

# --- leaders prices ---
def aapl = close(symbol = "AAPL");
def msft = close(symbol = "MSFT");
def nvda = close(symbol = "NVDA");
def amzn = close(symbol = "AMZN");
def googl = close(symbol = "GOOGL");
def meta = close(symbol = "META");
def tsla = close(symbol = "TSLA");

# --- bar-to-bar sign (uptick/downtick proxy) ---
def s1 = Sign(aapl - aapl[1]);
def s2 = Sign(msft - msft[1]);
def s3 = Sign(nvda - nvda[1]);
def s4 = Sign(amzn - amzn[1]);
def s5 = Sign(googl - googl[1]);
def s6 = Sign(meta - meta[1]);
def s7 = Sign(tsla - tsla[1]);

def MAG7raw = scalePerName * (s1 + s2 + s3 + s4 + s5 + s6 + s7);  # ~[-7,+7]*scale

# --- RTH session gates ---
def isRTH        = SecondsFromTime(0930) >= 0 and SecondsTillTime(1600) > 0;
def sessionStart = isRTH and !isRTH[1];

# --- cumulative (continuous display) ---
def cumMag7Raw = CompoundValue(1,
    if sessionStart then MAG7raw
    else if isRTH then cumMag7Raw[1] + MAG7raw
    else cumMag7Raw[1],
    0);

def CumMag7 = if smoothLen > 0 then Average(cumMag7Raw, smoothLen) else cumMag7Raw;

# --- plots ---
plot Zero = 0; Zero.SetDefaultColor(Color.GRAY);
plot pCumMag7 = CumMag7; pCumMag7.SetDefaultColor(Color.MAGENTA); pCumMag7.SetLineWeight(2);

plot pRawMAG7 = if showRawMAG7 then MAG7raw else Double.NaN;
pRawMAG7.SetDefaultColor(Color.DARK_GRAY);

# --- label ---
AddLabel(yes, "MAG7 " + AsText(Round(MAG7raw, 0)), Color.WHITE);
 

Attachments

  • TICK MAG SEPARATE.png
    TICK MAG SEPARATE.png
    526.1 KB · Views: 186
I find that when both histograms are in agreement, i.e. both positive or both negative, better probability that trend will follow in that direction.
What a fantastic job ! It is exactely what I need, $TICK and MAG7 equivalent ticks in a separate window. Many many thanks for your great job and your sharing.
 
What a fantastic job ! It is exactely what I need, $TICK and MAG7 equivalent ticks in a separate window. Many many thanks for your great job and your sharing.
Glad to help. This indicator is new to me also, so let me know what you observe in terms of signals, if you have time!
 
You might also be interested in a custom MAG7 index. You can paste the following directly into a chart's main symbol box (no code or indicator required) :

(AAPL+AMZN+GOOG+META+MSFT+NVDA+TSLA)

It is also possible to divide the whole thing by 7, which people often do. All that really does is change the scale of the Y-Axis though, so it's a not really necessary. The overall price action remains the same.
 
You might also be interested in a custom MAG7 index. You can paste the following directly into a chart's main symbol box (no code or indicator required) :


It is also possible to divide the whole thing by 7, which people often do. All that really does is change the scale of the Y-Axis though, so it's a not really necessary. The overall price action remains the same.
Hi @Joshua
Very interesting ! Thank you very much for this nice information.
 
You might also be interested in a custom MAG7 index. You can paste the following directly into a chart's main symbol box (no code or indicator required) :


It is also possible to divide the whole thing by 7, which people often do. All that really does is change the scale of the Y-Axis though, so it's a not really necessary. The overall price action remains the same.
Thank you...this is really fascinating. I didn't know u could do that. how do you divide by 7....right in the symbol box?
 

Join useThinkScript to post your question to a community of 21,000+ developers and traders.

Similar threads

Not the exact question you're looking for?

Start a new thread and receive assistance from our community.

87k+ Posts
470 Online
Create Post

Similar threads

Similar threads

The Market Trading Game Changer

Join 2,500+ subscribers inside the useThinkScript VIP Membership Club
  • Exclusive indicators
  • Proven strategies & setups
  • Private Discord community
  • ‘Buy The Dip’ signal alerts
  • Exclusive members-only content
  • Add-ons and resources
  • 1 full year of unlimited support

Frequently Asked Questions

What is useThinkScript?

useThinkScript is the #1 community of stock market investors using indicators and other tools to power their trading strategies. Traders of all skill levels use our forums to learn about scripting and indicators, help each other, and discover new ways to gain an edge in the markets.

How do I get started?

We get it. Our forum can be intimidating, if not overwhelming. With thousands of topics, tens of thousands of posts, our community has created an incredibly deep knowledge base for stock traders. No one can ever exhaust every resource provided on our site.

If you are new, or just looking for guidance, here are some helpful links to get you started.

What are the benefits of VIP Membership?
VIP members get exclusive access to these proven and tested premium indicators: Buy the Dip, Advanced Market Moves 2.0, Take Profit, and Volatility Trading Range. In addition, VIP members get access to over 50 VIP-only custom indicators, add-ons, and strategies, private VIP-only forums, private Discord channel to discuss trades and strategies in real-time, customer support, trade alerts, and much more. Learn all about VIP membership here.
How can I access the premium indicators?
To access the premium indicators, which are plug and play ready, sign up for VIP membership here.
Back
Top