Name That Indicator, Please Help!

horserider

Well-known member
VIP
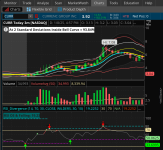
I have noticed a lot of people want to use only arrows as signals to trade. Some fancy dan arrow studies have shown up. So can anyone identify this "super duper complicated" arrow indicator.
DtyppZF.png

There is a hint in the text above.
 

Attachments

  • DtyppZF.png
    DtyppZF.png
    94.8 KB · Views: 259

Join useThinkScript to post your question to a community of 21,000+ developers and traders.

Does anyone know what study/script/indicator is this on thinkorswim platform ? It’s basically the arrow buy/sell signal. It’s not SMA/EMA crossover for sure. Ans or any help identifying this indicator/study would be greatly appreciated! 🙏🏻
p8gOrJU.jpg
 
Last edited by a moderator:
Looks like hull moving averages with buy and sell signal arrow
Thanks for the replay brotha! But I have tried few hull moving avg with buy/sell signals. But couldn’t found the exact one which is in this pic. They were different than this one. And also the study inputs aren’t the same which appears next to the study name on top of the chart inside the parentheses.
 
Hi all,

Im trying to figure what indicator the dotted Purple lines are. From what Ive been told, the dotted Purple lines are Value Area Highs/Lows for YTD. And the Green and Red dotted lines are Value Area Highs/Lows for OpEx Cycles. I still cannot find out how to do this on TOS. Any help?


FEAGjuiXEA0teBG?format=png&name=900x900.png
 
Hi all,

Im trying to figure what indicator the dotted Purple lines are. From what Ive been told, the dotted Purple lines are Value Area Highs/Lows for YTD. And the Green and Red dotted lines are Value Area Highs/Lows for OpEx Cycles. I still cannot find out how to do this on TOS. Any help?
There isn't really anyway to tell :(
 
Does anyone know what study/script/indicator is this on thinkorswim platform ? It’s basically the arrow buy/sell signal. It’s not SMA/EMA crossover for sure. Ans or any help identifying this indicator/study would be greatly appreciated! 🙏🏻
I saw this indicator long time ago here on Reddit
We have many master scripture here and hopefully someone can crack the code that would be nice..... Let see how can show some skills....
 
Last edited by a moderator:
I also have been intrigued by this indicator and his claims (Dyno Trading).
I tried to contact him to ask questions but he was very short and rude with me. Just wanted to sell his product. It maybe legit, who knows.
He does not have very good reviews. Just warning you to be cautious - If it sounds too good to be true, it probably is.

Here is a link to another chat line that shows the chart comparison. Scroll down to member "erwinbeckers" and his 2nd post:
https://futures.io/trading-reviews-vendors/57019-volume-analysis-dyno-trading.html
 
Last edited:
I was able to recreate a close representation of the Dyno Trading Volume indicator (Which I do not believe is based on volume but a Linear Regression crossover). I saw an article from Lizard Indicators (Link provided in the commented section of the code) and basically recreated their version in TOS and it looks fairly close.
Please review and let me know what you think. I also combine this with the VWAP and 200 EMA. The bars are color coded and this does not repaint. Green bars = Buy, Red bars = Sell and Yellow bars = Stay out (Neutral).


# LinearRegCh100 RegressionDivergence - Trigger Lines - Trend Cross
# From Lizard Indicators Link: https://www.lizardindicators.com/trigger-lines-cross-vs-thrust/
# Line #1 - Fast = LinReg (80)
# Line #2 - Slow = EXPEMA[LinReg (80)]


input price = close;
input displace = 0;
input LinRegLength = 80;
input EMAlength = 20;

#Definitions
def LinReg = Inertia(price[-displace], LinRegLength);
def EMA_LR = ExpAverage(LinReg[-displace], EMAlength);
def Body = (open + close)/2;

# Defining Long/Short Filters (these instructions determine entries / exits)
# Entry Requirements
def Long_Entry = close > LinReg and close > EMA_LR and body > LinReg and body > EMA_LR and close > high[1] and body > body[1];
# LinReg > LinReg[1] and
def Long_Stay_In = close > LinReg and close > EMA_LR;
def Long_Exit = (close < LinReg or close < EMA_LR) or Long_Stay_In == 0;
def Long_State = If Long_Entry then 1 else if Long_Exit then 0 else Long_State[1];
plot Long = Long_State;

# Exit Requirements
def Short_Entry = close < LinReg and close < EMA_LR and body < LinReg and body < EMA_LR and close < low[1] and body < body[1];
# LinReg < LinReg[1] and
def Short_Stay_In = close < LinReg and close < EMA_LR;
def Short_Exit = (close > LinReg or close > EMA_LR) or Short_Stay_In == 0;
def Short_State = If Short_Entry then 1 else if Short_Exit then 0 else Short_State[1];
plot Short = Short_State;

#Adding Linear Regression Plots
plot LR = LinReg;
LR.SetDefaultColor(Color.BLUE);
plot EMA_LinReg = EMA_LR;

# Coloring Bars
AssignPriceColor(if Long_State then Color.GREEN else if Short_State then Color.RED else Color.Yellow);

DefineGlobalColor("Bullish", Color.Green);
DefineGlobalColor("Bearish", Color.Red);
AddCloud(EMA_LR, LinReg, GlobalColor("Bearish"), GlobalColor("Bullish"));


# End
 
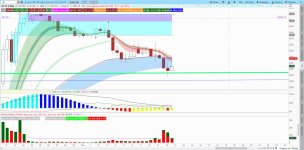
The small horizontal blue lines that appear above or below every bar. It looks like a trailing stop, but every one I've used doesn't look quite like this. Does anyone recognize it?

AaX6JBc.png
 

Similar threads

Not the exact question you're looking for?

Start a new thread and receive assistance from our community.

87k+ Posts
391 Online
Create Post

Similar threads

Similar threads

The Market Trading Game Changer

Join 2,500+ subscribers inside the useThinkScript VIP Membership Club
  • Exclusive indicators
  • Proven strategies & setups
  • Private Discord community
  • ‘Buy The Dip’ signal alerts
  • Exclusive members-only content
  • Add-ons and resources
  • 1 full year of unlimited support

Frequently Asked Questions

What is useThinkScript?

useThinkScript is the #1 community of stock market investors using indicators and other tools to power their trading strategies. Traders of all skill levels use our forums to learn about scripting and indicators, help each other, and discover new ways to gain an edge in the markets.

How do I get started?

We get it. Our forum can be intimidating, if not overwhelming. With thousands of topics, tens of thousands of posts, our community has created an incredibly deep knowledge base for stock traders. No one can ever exhaust every resource provided on our site.

If you are new, or just looking for guidance, here are some helpful links to get you started.

What are the benefits of VIP Membership?
VIP members get exclusive access to these proven and tested premium indicators: Buy the Dip, Advanced Market Moves 2.0, Take Profit, and Volatility Trading Range. In addition, VIP members get access to over 50 VIP-only custom indicators, add-ons, and strategies, private VIP-only forums, private Discord channel to discuss trades and strategies in real-time, customer support, trade alerts, and much more. Learn all about VIP membership here.
How can I access the premium indicators?
To access the premium indicators, which are plug and play ready, sign up for VIP membership here.
Back
Top