Multi-Day VWAP Indicator for ThinkorSwim

icmoflow

New member
Does anyone have a multi-day VWAP indicator that will show the 1 HR VWAP, multi-day vwap, YTD vwap for instance on any time frame ? I'm looking for the daily VWAP on the 1 min chart and also to add an hourly VWAP or multi-day VWAP. Thanks

Will the Anchored VWAP script work in this case?
 
Last edited:

Join useThinkScript to post your question to a community of 21,000+ developers and traders.

VWAP already has day,week, and month. Do not think an hourly is possible. Maybe describe the exact VWAP periods you want and see what might show up. For what purpose ??????

i5umtBP.png
 

Attachments

  • i5umtBP.png
    i5umtBP.png
    99.8 KB · Views: 438
This is pretty good Hourse Rider, what I would like to add is a Hourly VWAP and even 15 min, simply for support and resistance levels intraday, I can use Darvas Boxes but VWAP I think is the "true" price. Thanks Horse Rider
 
Well it's a "cumulative " indicator. The daily shows the daily thus far based on V and P I'm looking to go back the last 15 min or hr not just the cumulative VWAP for the day. I appreciate your efforts, I'll see what I can come up with. Thanks again Horse Rider
 
@Stephan908vkt 2 day VWAP

Code:
input numDevDn = -2.0;
input numDevUp = 2.0;
input timeFrame = {default TWO_DAY, DAY, THREE_DAY,WEEK, MONTH};
input showbubbles = yes;
input bubbleoffset = 2;

def cap = getAggregationPeriod();
def errorInAggregation =
    timeFrame == timeFrame.DAY and cap >= AggregationPeriod.WEEK or
    timeFrame == timeFrame.WEEK and cap >= AggregationPeriod.MONTH;
assert(!errorInAggregation, "timeFrame should be not less than current chart aggregation period");

def yyyyMmDd = getYyyyMmDd();
def periodIndx;
switch (timeFrame) {
case DAY:
    periodIndx = yyyyMmDd;
case TWO_DAY:
    periodIndx = Floor((daysFromDate(first(yyyyMmDd)) + getDayOfWeek(first(yyyyMmDd))) / 2);
case THREE_DAY:
    periodIndx = Floor((daysFromDate(first(yyyyMmDd)) + getDayOfWeek(first(yyyyMmDd))) / 3);
case WEEK:
    periodIndx = Floor((daysFromDate(first(yyyyMmDd)) + getDayOfWeek(first(yyyyMmDd))) / 7);
case MONTH:
    periodIndx = roundDown(yyyyMmDd / 100, 0);
}
def isPeriodRolled = compoundValue(1, periodIndx != periodIndx[1], yes);

def volumeSum;
def volumeVwapSum;
def volumeVwap2Sum;

if (isPeriodRolled) {
    volumeSum = volume;
    volumeVwapSum = volume * vwap;
    volumeVwap2Sum = volume * Sqr(vwap);
} else {
    volumeSum = compoundValue(1, volumeSum[1] + volume, volume);
    volumeVwapSum = compoundValue(1, volumeVwapSum[1] + volume * vwap, volume * vwap);
    volumeVwap2Sum = compoundValue(1, volumeVwap2Sum[1] + volume * Sqr(vwap), volume * Sqr(vwap));
}
def price = volumeVwapSum / volumeSum;
def deviation = Sqrt(Max(volumeVwap2Sum / volumeSum - Sqr(price), 0));

plot VWAP = price;
#plot UpperBand = price + numDevUp * deviation;
#plot LowerBand = price + numDevDn * deviation;

VWAP.setDefaultColor(getColor(6));
#UpperBand.setDefaultColor(getColor(2));
#LowerBand.setDefaultColor(getColor(4));

####Bubbles
def n = BubbleOffset;
def n1 = n + 1;
AddChartBubble(showbubbles and IsNaN(close[n]) and !IsNaN(close[n1]) , price[n1] , "VWAP 2D: " + Round(price[n1] , 2), Color.GREEN);

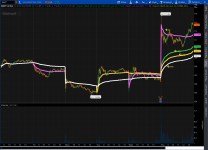
https://tos.mx/nSDFiqb
 
Hey @horserider, I'm not a consistently profitable trader so I can't really say how successful it is for me, but I took a couple SMB courses a few years ago so the way I'm using the 2-day vwap is look for a continuation move after a directional/trend day, wait for the test of the 2-day vwap and watch for a reversal. I probably didn't explain that very well so here are some screenshots

The purple line is the 2-day vwap. On 8/22, we had a strong down day, on 8/23, the plan would be to wait for a test of the 2-day vwap for a short

h7RYrBE.png


Strong up day on 8/9 (Friday) so on Monday I was looking for a pullback to the 2-day vwap for a long opportunity.

o0xccvJ.png


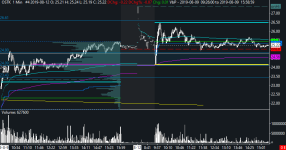
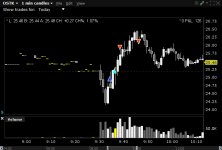
Here's a screenshot of the OSTK trade I took. I try not to fade it without a little bit of confirmation so for OSTK, I waited for it to get back above the intraday vwap and also the prior close

EZ84uzW.png


Anyway, thank you so much again for sharing your indicator.
 

Attachments

  • h7RYrBE.png
    h7RYrBE.png
    48.5 KB · Views: 313
  • o0xccvJ.png
    o0xccvJ.png
    29.7 KB · Views: 293
  • EZ84uzW.png
    EZ84uzW.png
    21.8 KB · Views: 375
hello there,
when i used the below shared file for multiday VWAP, it lies on top of the normal VWAP in TOS , not sure if is meant to be , or is it because it is after hour.
i was expecting to see two line one for VWAP and one for MDVWAP
https://tos.mx/nSDFiqb
 
Can someone help me with this script?
When I have TWO_DAY VWAP selected, it does not always work. It sometimes acts as the current VWAP. Sometimes the 3-day VWAP acts as a 2-day VWAP, other times it shows current VWAP as well.

input timeFrame = {DAY, WEEK, MONTH, default TWO_DAY, THREE_DAY};

def cap = getAggregationPeriod();
def errorInAggregation =
timeFrame == timeFrame.DAY and cap >= AggregationPeriod.WEEK or
timeFrame == timeFrame.WEEK and cap >= AggregationPeriod.MONTH;
assert(!errorInAggregation, "timeFrame should be not less than current chart aggregation period");

def yyyyMmDd = getYyyyMmDd();
def periodIndx;
switch (timeFrame) {
case DAY:
periodIndx = yyyyMmDd;
case WEEK:
periodIndx = Floor((daysFromDate(first(yyyyMmDd)) + getDayOfWeek(first(yyyyMmDd))) / 7);
case MONTH:
periodIndx = roundDown(yyyyMmDd / 100, 0);
case TWO_DAY:
periodIndx = Floor((daysFromDate(first(yyyyMmDd)) + getDayOfWeek(first(yyyyMmDd))) / 2);
case THREE_DAY:
periodIndx = Floor((daysFromDate(first(yyyyMmDd)) + getDayOfWeek(first(yyyyMmDd))) / 3);
}
def isPeriodRolled = compoundValue(1, periodIndx != periodIndx[1], yes);

def volumeSum;
def volumeVwapSum;
def volumeVwap2Sum;

if (isPeriodRolled) {
volumeSum = volume;
volumeVwapSum = volume * vwap;
volumeVwap2Sum = volume * Sqr(vwap);
} else {
volumeSum = compoundValue(1, volumeSum[1] + volume, volume);
volumeVwapSum = compoundValue(1, volumeVwapSum[1] + volume * vwap, volume * vwap);
volumeVwap2Sum = compoundValue(1, volumeVwap2Sum[1] + volume * Sqr(vwap), volume * Sqr(vwap));
}
def price = volumeVwapSum / volumeSum;

plot VWAP = price;
 
Last edited:
Can someone help me with this script?
When I have TWO_DAY VWAP selected, it does not always work. It sometimes acts as the current VWAP. Sometimes the 3-day VWAP acts as a 2-day VWAP, other times it shows current VWAP as well.

See if this study from Growex @Thinkscript Lounge that I modified to allow you to choose the number of days to include in the vwap.

Capture.jpg
Ruby:
input days   = 3;
def ymd      = GetYYYYMMDD();
def ok       = !IsNaN(close);
def capture  = ok and ymd != ymd[1];
def dayCount = CompoundValue(1, if capture
                                then dayCount[1] + 1
                                else dayCount[1], 0);
def thisDay  = (HighestAll(dayCount) - dayCount) + 1;

#hint:Plots the deviation channels based on the price-times-volume consideration. This may be called the dispersion of price-volume data.
#VM_MIDAS_StandartDeviationBands coded by Growex;
def Data = BarNumber();#Barnumber at the bar being calculated
def Start_Bar = if thisday[1]==days+1 and thisday==days then barnumber() else start_bar[1];

input price = close;
def Start_Cond =  Data >= highestall(Start_Bar);#If true plotting is happening
def Price_x_Vol = if Start_Cond then Price_x_Vol[1] + price * volume else 0;#Cumulative Price times Volume
def cumvolume = if Start_Cond then cumvolume[1] + volume else 0;# Cumulative volume
plot Equiv_price = Price_x_Vol / cumvolume;# The equivalent price
def bars = data - Start_Bar;
def sample = if Start_Cond then sample[1] + sqr(price - Equiv_price) else 0;# Sum of the Square-Root of difference between the current price and the equivalent price. This also may be called the statistical total variance
def var = sample/bars;# Variance per bar
def dev = sqrt(var);# By statistical-definition, the standard deviation (SD) equals the square root of the variance
plot UBand = Equiv_price + dev;# The 1-deviation upper band
plot LBand = Equiv_price -  dev;# The 1-deviation lower band
plot UBand2 = Equiv_price + 2 * dev;# The 2-deviation upper band
plot LBand2 = Equiv_price - 2 * dev;# The 2-deviation lower band
plot UBand3 = Equiv_price + 3 * dev;# The 3-deviation upper band
plot LBand3 = Equiv_price - 3 * dev;# The 1-deviation lower band
#end
 
I suppose technically it would be a “2 day anchored vwap”, but instead of anchoring the point myself, the script auto anchors 2 day, 3 day, week,

Apologies if this one has been discussed in any detail, I’m having trouble finding similar threads. I’m very interested in using multi timeframe VWAP, but the few bits of script I have used don’t work properly all the time, seemingly on Mondays. I think its the way the data is being pulled in the code, which wouldn’t account for the weekend. I have played around with adjusting the timeframe on the charts themselves, and after Monday it appears to work, but its a bit of a pain and very perplexing.

Is there any strings or commands I can add that would adjust the aggregate I am pulling from to offset this? Anyone have a multi timeframe VWAP study that takes this into account? When it works, it is a great indicator. 2 day and 5 day vwap in particular are very strong.

Much appreciated!
 
Last edited by a moderator:
I suppose technically it would be a “2 day anchored vwap”, but instead of anchoring the point myself, the script auto anchors 2 day, 3 day, week,

Apologies if this one has been discussed in any detail, I’m having trouble finding similar threads. I’m very interested in using multi timeframe VWAP, but the few bits of script I have used don’t work properly all the time, seemingly on Mondays. I think its the way the data is being pulled in the code, which wouldn’t account for the weekend. I have played around with adjusting the timeframe on the charts themselves, and after Monday it appears to work, but its a bit of a pain and very perplexing.

Is there any strings or commands I can add that would adjust the aggregate I am pulling from to offset this? Anyone have a multi timeframe VWAP study that takes this into account? When it works, it is a great indicator. 2 day and 5 day vwap in particular are very strong.

Much appreciated!
Are you using the @SleepyZ script in the post above yours?
 

Similar threads

Not the exact question you're looking for?

Start a new thread and receive assistance from our community.

87k+ Posts
415 Online
Create Post

Similar threads

Similar threads

The Market Trading Game Changer

Join 2,500+ subscribers inside the useThinkScript VIP Membership Club
  • Exclusive indicators
  • Proven strategies & setups
  • Private Discord community
  • ‘Buy The Dip’ signal alerts
  • Exclusive members-only content
  • Add-ons and resources
  • 1 full year of unlimited support

Frequently Asked Questions

What is useThinkScript?

useThinkScript is the #1 community of stock market investors using indicators and other tools to power their trading strategies. Traders of all skill levels use our forums to learn about scripting and indicators, help each other, and discover new ways to gain an edge in the markets.

How do I get started?

We get it. Our forum can be intimidating, if not overwhelming. With thousands of topics, tens of thousands of posts, our community has created an incredibly deep knowledge base for stock traders. No one can ever exhaust every resource provided on our site.

If you are new, or just looking for guidance, here are some helpful links to get you started.

What are the benefits of VIP Membership?
VIP members get exclusive access to these proven and tested premium indicators: Buy the Dip, Advanced Market Moves 2.0, Take Profit, and Volatility Trading Range. In addition, VIP members get access to over 50 VIP-only custom indicators, add-ons, and strategies, private VIP-only forums, private Discord channel to discuss trades and strategies in real-time, customer support, trade alerts, and much more. Learn all about VIP membership here.
How can I access the premium indicators?
To access the premium indicators, which are plug and play ready, sign up for VIP membership here.
Back
Top