Repaints MTF New Week Opening Gap (NWOG) For ThinkOrSwim

Repaints

FutureTony

Well-known member
VIP
For those that follow the ICT community, there has been a lot of discussion on the gap that forms when globex trading opens up on Sunday (NWOG).

This concept is very similar to something I had already been using so I reworded that to create an indicator that displays the last 3 gaps for your trading pleasure:

rz2SLZn.png


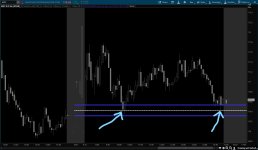
A few caveats. This indicator relies on pulling data from your charts. If you want the last 3 weeks of gaps, I suggest having at least 15 days of data on the chart. I like to keep my charts clean so the default is to chart these on the right margin (expansion area) of your chart.

You need to make sure you have that activated (I have 5 bars in the image above). If you choose to have them drawn across the chart (showOnRight = no), they will only draw for the current day. You will have to change the code if you want it to show across the entire chart. Again, I find that too busy as I am using this for day trading.

You can also toggle to show labels or bubbles that indicate which area is this week, last week, two weeks ago. One last thing - you can change the indicator timeframe from weekly to daily to get new day opening gaps (NDOG) as well. This was mostly a quick and dirty effort, I'm sure there are ways to simplify the code to make it easier to maintain if anyone is up for it...I'm happy with it for now.

Updated the code to use 5 weeks instead of 3 weeks. Cheers!
shared study link: http://tos.mx/BhtPVOV Click here for --> Easiest way to load shared links
Ruby:
# Global Color setup
# Created by @tony_futures inspired by ICT concept
DefineGlobalColor("weekly", Color.DARK_ORANGE);
DefineGlobalColor("weekly2", CreateColor(136, 93, 100));
DefineGlobalColor("weekly3", COLOR.PLUM);
DefineGlobalColor("weekly4", COLOR.WHITE);
DefineGlobalColor("weekly5", COLOR.CYAN);

#Calculate the gaps and the midpoints
input aggregationPeriod = AggregationPeriod.WEEK;
def weeklyClose = close(period = aggregationPeriod);
def weeklyOpen = open(period = aggregationPeriod);
def weeklyChange = weeklyClose != weeklyClose[1];
def prevWeeklyClose = if weeklyChange then Round(weeklyClose[1],2) else prevWeeklyClose[1];
def newWeekOpen = if weeklyChange then Round(weeklyOpen,2) else newWeekOpen[1];
def gapUp = newWeekOpen > prevWeeklyClose;
def halfAmount = AbsValue(newWeekOpen - prevWeeklyClose) / 2;
def halfGap = if gapUp then (prevWeeklyClose + halfAmount) else (newWeekOpen + halfAmount);
def oneBackClose = if weeklyChange then prevWeeklyClose[1] else oneBackClose[1];
def oneBackOpen = if weeklyChange then newWeekOpen[1] else oneBackOpen[1];
def twoBackClose = if weeklyChange then oneBackClose[1] else twoBackClose[1];
def twoBackOpen = if weeklyChange then oneBackOpen[1] else twoBackOpen[1];
def halfAmount2 = AbsValue(oneBackOpen - oneBackClose) / 2;
def gapUp2 = oneBackOpen > oneBackClose;
def halfGap2 = if gapUp2 then (oneBackClose + halfAmount2) else (oneBackOpen + halfAmount2);
def halfAmount3 = AbsValue(twoBackOpen - twoBackClose) / 2;
def gapUp3 = twoBackOpen > twoBackClose;
def halfGap3 = if gapUp3 then (twoBackClose + halfAmount3) else (twoBackOpen + halfAmount3);
def threeBackClose = if weeklyChange then twoBackClose[1] else threeBackClose[1];
def threeBackOpen = if weeklyChange then twoBackOpen[1] else threeBackOpen[1];

def halfAmount4 = AbsValue(threeBackOpen - threeBackClose) / 2;
def gapUp4 = threeBackOpen > threeBackClose;
def halfGap4 = if gapUp4 then (threeBackClose + halfAmount4) else (threeBackOpen + halfAmount4);
def fourBackClose = if weeklyChange then threeBackClose[1] else fourBackClose[1];
def fourBackOpen = if weeklyChange then threeBackOpen[1] else fourBackOpen[1];

def halfAmount5 = AbsValue(fourBackOpen - fourBackClose) / 2;
def gapUp5 = fourBackOpen > fourBackClose;
def halfGap5 = if gapUp5 then (fourBackClose + halfAmount5) else (fourBackOpen + halfAmount5);

input plotLines = yes;
def Today = GetLastDay() == GetDay();
input showOnRight = yes;
def exp = if showOnRight then IsNaN(close[1]) else yes;

plot week1 = if exp and Today and plotLines then prevWeeklyClose else Double.NaN;
week1.setDefaultColor(GlobalColor("weekly"));
week1.setLineWeight(2);
week1.hideBubble();

plot week2 = if exp and Today and plotLines then newWeekOpen else Double.NaN;
week2.setDefaultColor(GlobalColor("weekly"));
week2.setLineWeight(2);
week2.hideBubble();

plot week3 = if exp and Today and plotLines then oneBackClose else Double.NaN;
week3.setDefaultColor(GlobalColor("weekly2"));
week3.setLineWeight(2);
week3.hideBubble();

plot week4 = if exp and Today and plotLines then oneBackOpen else Double.NaN;
week4.setDefaultColor(GlobalColor("weekly2"));
week4.setLineWeight(2);
week4.hideBubble();

plot week5 = if exp and Today and plotLines then twoBackClose else Double.NaN;
week5.setDefaultColor(GlobalColor("weekly3"));
week5.setLineWeight(2);
week5.hideBubble();

plot week6 = if exp and Today and plotLines then twoBackOpen else Double.NaN;
week6.setDefaultColor(GlobalColor("weekly3"));
week6.setLineWeight(2);
week6.hideBubble();

plot week7 = if exp and Today and plotLines then threeBackClose else Double.NaN;
week7.setDefaultColor(GlobalColor("weekly4"));
week7.setLineWeight(2);
week7.hideBubble();

plot week8 = if exp and Today and plotLines then threeBackOpen else Double.NaN;
week8.setDefaultColor(GlobalColor("weekly4"));
week8.setLineWeight(2);
week8.hideBubble();

plot week9 = if exp and Today and plotLines then fourBackClose else Double.NaN;
week9.setDefaultColor(GlobalColor("weekly5"));
week9.setLineWeight(2);
week9.hideBubble();

plot week10 = if exp and Today and plotLines then fourBackOpen else Double.NaN;
week10.setDefaultColor(GlobalColor("weekly5"));
week10.setLineWeight(2);
week10.hideBubble();

plot halfWay = if exp and Today and plotLines then halfGap else Double.NaN;
halfWay.setDefaultColor(Color.GRAY);
halfWay.hideBubble();

plot halfWay2 = if exp and Today and plotLines then halfGap2 else Double.NaN;
halfWay2.setDefaultColor(Color.GRAY);
halfWay2.hideBubble();

plot halfWay3 = if exp and Today and plotLines then halfGap3 else Double.NaN;
halfWay3.setDefaultColor(Color.GRAY);
halfWay3.hideBubble();

plot halfWay4 = if exp and Today and plotLines then halfGap4 else Double.NaN;
halfWay4.setDefaultColor(Color.GRAY);
halfWay4.hideBubble();

plot halfWay5 = if exp and Today and plotLines then halfGap5 else Double.NaN;
halfWay5.setDefaultColor(Color.GRAY);
halfWay5.hideBubble();

input showBubbles = no;
AddChartBubble(showBubbles and exp and !exp[1], if gapUp then week1 else week2,"Current",GlobalColor("weekly"),no);
AddChartBubble(showBubbles and exp and !exp[1], if gapUp2 then week3 else week4,"Previous",GlobalColor("weekly2"),no);
AddChartBubble(showBubbles and exp and !exp[1], if gapUp3 then week5 else week6,"Two Back",GlobalColor("weekly3"),no);
input showLabels = no;
AddLabel(showLabels,"Current", GlobalColor("weekly"));
AddLabel(showLabels,"Previous", GlobalColor("weekly2"));
AddLabel(showLabels,"Two Back", GlobalColor("weekly3"));
AddLabel(showLabels,"Three Back", GlobalColor("weekly4"));
AddLabel(showLabels,"Four Back", GlobalColor("weekly5"));
 
Last edited by a moderator:
@FutureTony , thank you for writing this, I'm trying out the 5 week code.. Just a few questions:
  • NWOG goes from Closing Price at 4:59pm ET of Friday to Opening Price of Sunday 6PM ET. Could you please confirm if this does exactly between those times?
  • I don't see the Chart bubble name show up on the right. How do I get it to show whether it is current week or from Week(x)? Also, is there a way to have the label show up say 50 bars before the last candle.. something like how I've marked it in the image?
  • For I think the current week, the line shows up drawn across the chart, I'm thinking that is for the current week, or Week 0. However, the other weeks still show up on right, when Right = No. is there anyway to change that as well to show up horizontal across the chart?

Thank you for doing this, it helps .
 
Last edited:
@FutureTony , thank you for writing this, I'm trying out the 5 week code.. Just a few questions:
  • NWOG goes from Closing Price at 4:59pm ET of Friday to Opening Price of Sunday 6PM ET. Could you please confirm if this does exactly between those times?
  • I don't see the Chart bubble name show up on the right. How do I get it to show whether it is current week or from Week(x)? Also, is there a way to have the label show up say 50 bars before the last candle.. something like how I've marked it in the image?
  • For I think the current week, the line shows up drawn across the chart, I'm thinking that is for the current week, or Week 0. However, the other weeks still show up on right, when Right = No. is there anyway to change that as well to show up horizontal across the chart?

Thank you for doing this, it helps .
  • The weekly open and close is derived from TOS so will be the exact same as looking at the weekly candle. This is simply automating those prices on a smaller timeframe. If you want price from an exact point in time, you may have to draw those manually.
  • I will admit that I wrote this study to exist on the right and the bubbles were only working there. I have updated to print the bubbles on the right or the left now. They appear pretty much as you requested.
  • I'm not sure why you don't see the lines going further. They should appear across the current day if you have the right = no as per my picture below:
JzOialg.png


Ruby:
# Global Color setup
# Created by @tony_futures inspired by ICT concept
DefineGlobalColor("weekly", Color.DARK_ORANGE);
DefineGlobalColor("weekly2", CreateColor(136, 93, 100));
DefineGlobalColor("weekly3", COLOR.PLUM);
DefineGlobalColor("weekly4", COLOR.WHITE);
DefineGlobalColor("weekly5", COLOR.CYAN);

#Calculate the gaps and the midpoints
input aggregationPeriod = AggregationPeriod.WEEK;
def weeklyClose = close(period = aggregationPeriod);
def weeklyOpen = open(period = aggregationPeriod);
def weeklyChange = weeklyClose != weeklyClose[1];
def prevWeeklyClose = if weeklyChange then Round(weeklyClose[1],2) else prevWeeklyClose[1];
def newWeekOpen = if weeklyChange then Round(weeklyOpen,2) else newWeekOpen[1];
def gapUp = newWeekOpen > prevWeeklyClose;
def halfAmount = AbsValue(newWeekOpen - prevWeeklyClose) / 2;
def halfGap = if gapUp then (prevWeeklyClose + halfAmount) else (newWeekOpen + halfAmount);
def oneBackClose = if weeklyChange then prevWeeklyClose[1] else oneBackClose[1];
def oneBackOpen = if weeklyChange then newWeekOpen[1] else oneBackOpen[1];
def twoBackClose = if weeklyChange then oneBackClose[1] else twoBackClose[1];
def twoBackOpen = if weeklyChange then oneBackOpen[1] else twoBackOpen[1];
def halfAmount2 = AbsValue(oneBackOpen - oneBackClose) / 2;
def gapUp2 = oneBackOpen > oneBackClose;
def halfGap2 = if gapUp2 then (oneBackClose + halfAmount2) else (oneBackOpen + halfAmount2);
def halfAmount3 = AbsValue(twoBackOpen - twoBackClose) / 2;
def gapUp3 = twoBackOpen > twoBackClose;
def halfGap3 = if gapUp3 then (twoBackClose + halfAmount3) else (twoBackOpen + halfAmount3);
def threeBackClose = if weeklyChange then twoBackClose[1] else threeBackClose[1];
def threeBackOpen = if weeklyChange then twoBackOpen[1] else threeBackOpen[1];

def halfAmount4 = AbsValue(threeBackOpen - threeBackClose) / 2;
def gapUp4 = threeBackOpen > threeBackClose;
def halfGap4 = if gapUp4 then (threeBackClose + halfAmount4) else (threeBackOpen + halfAmount4);
def fourBackClose = if weeklyChange then threeBackClose[1] else fourBackClose[1];
def fourBackOpen = if weeklyChange then threeBackOpen[1] else fourBackOpen[1];

def halfAmount5 = AbsValue(fourBackOpen - fourBackClose) / 2;
def gapUp5 = fourBackOpen > fourBackClose;
def halfGap5 = if gapUp5 then (fourBackClose + halfAmount5) else (fourBackOpen + halfAmount5);

input plotLines = yes;
def Today = GetLastDay() == GetDay();
input showOnRight = yes;
input offset = 1;
def exp = if showOnRight then IsNaN(close[offset]) else yes;

plot week1 = if exp and Today and plotLines then prevWeeklyClose else Double.NaN;
week1.setDefaultColor(GlobalColor("weekly"));
week1.setLineWeight(2);
week1.hideBubble();

plot week2 = if exp and Today and plotLines then newWeekOpen else Double.NaN;
week2.setDefaultColor(GlobalColor("weekly"));
week2.setLineWeight(2);
week2.hideBubble();

plot week3 = if exp and Today and plotLines then oneBackClose else Double.NaN;
week3.setDefaultColor(GlobalColor("weekly2"));
week3.setLineWeight(2);
week3.hideBubble();

plot week4 = if exp and Today and plotLines then oneBackOpen else Double.NaN;
week4.setDefaultColor(GlobalColor("weekly2"));
week4.setLineWeight(2);
week4.hideBubble();

plot week5 = if exp and Today and plotLines then twoBackClose else Double.NaN;
week5.setDefaultColor(GlobalColor("weekly3"));
week5.setLineWeight(2);
week5.hideBubble();

plot week6 = if exp and Today and plotLines then twoBackOpen else Double.NaN;
week6.setDefaultColor(GlobalColor("weekly3"));
week6.setLineWeight(2);
week6.hideBubble();

plot week7 = if exp and Today and plotLines then threeBackClose else Double.NaN;
week7.setDefaultColor(GlobalColor("weekly4"));
week7.setLineWeight(2);
week7.hideBubble();

plot week8 = if exp and Today and plotLines then threeBackOpen else Double.NaN;
week8.setDefaultColor(GlobalColor("weekly4"));
week8.setLineWeight(2);
week8.hideBubble();

plot week9 = if exp and Today and plotLines then fourBackClose else Double.NaN;
week9.setDefaultColor(GlobalColor("weekly5"));
week9.setLineWeight(2);
week9.hideBubble();

plot week10 = if exp and Today and plotLines then fourBackOpen else Double.NaN;
week10.setDefaultColor(GlobalColor("weekly5"));
week10.setLineWeight(2);
week10.hideBubble();

plot halfWay = if exp and Today and plotLines then halfGap else Double.NaN;
halfWay.setDefaultColor(Color.GRAY);
halfWay.hideBubble();

plot halfWay2 = if exp and Today and plotLines then halfGap2 else Double.NaN;
halfWay2.setDefaultColor(Color.GRAY);
halfWay2.hideBubble();

plot halfWay3 = if exp and Today and plotLines then halfGap3 else Double.NaN;
halfWay3.setDefaultColor(Color.GRAY);
halfWay3.hideBubble();

plot halfWay4 = if exp and Today and plotLines then halfGap4 else Double.NaN;
halfWay4.setDefaultColor(Color.GRAY);
halfWay4.hideBubble();

plot halfWay5 = if exp and Today and plotLines then halfGap5 else Double.NaN;
halfWay5.setDefaultColor(Color.GRAY);
halfWay5.hideBubble();

input showBubbles = no;
AddChartBubble(showBubbles and exp and !exp[1], if gapUp then week1 else week2,"Current",GlobalColor("weekly"),no);
AddChartBubble(showBubbles and exp and !exp[1], if gapUp2 then week3 else week4,"Previous",GlobalColor("weekly2"),no);
AddChartBubble(showBubbles and exp and !exp[1], if gapUp3 then week5 else week6,"Two Back",GlobalColor("weekly3"),no);
AddChartBubble(showBubbles and exp and !exp[1], if gapUp4 then week7 else week8,"Three Back",GlobalColor("weekly4"),no);
AddChartBubble(showBubbles and exp and !exp[1], if gapUp5 then week9 else week10,"Four Back",GlobalColor("weekly5"),no);

input showBubblesLeft = no;
AddChartBubble(showBubblesLeft and Today and !Today[1], if gapUp then week1 else week2,"Current",GlobalColor("weekly"),no);
AddChartBubble(showBubblesLeft and Today and !Today[1], if gapUp2 then week3 else week4,"Previous",GlobalColor("weekly2"),no);
AddChartBubble(showBubblesLeft and Today and !Today[1], if gapUp3 then week5 else week6,"Two Back",GlobalColor("weekly3"),no);
AddChartBubble(showBubblesLeft and Today and !Today[1], if gapUp4 then week7 else week8,"Three Back",GlobalColor("weekly4"),no);
AddChartBubble(showBubblesLeft and Today and !Today[1], if gapUp5 then week9 else week10,"Four Back",GlobalColor("weekly5"),no);

input showLabels = no;
AddLabel(showLabels,"Current", GlobalColor("weekly"));
AddLabel(showLabels,"Previous", GlobalColor("weekly2"));
AddLabel(showLabels,"Two Back", GlobalColor("weekly3"));
AddLabel(showLabels,"Three Back", GlobalColor("weekly4"));
AddLabel(showLabels,"Four Back", GlobalColor("weekly5"));
Thank you, let me see if I'm able to change that manually... new to coding on Think script!
 
Thank you, let me see if I'm able to change that manually... new to coding on Think script!
Good luck! And if you truly want the lines across your entire chart, change this line:

def Today = GetLastDay() == GetDay();

to

def Today = yes;

And they will print and only change once per week. I find that super messy but to each their own. Note, that will also mess up the bubbles on the left so you would have to choose if you want them or change the show bubble logic to print on the right edge.
@FutureTony Hi bro, thanks again for this script. But I think when on a daily TF, the gap line does not plot.

As below image.


Cheers
 
@FutureTony Hi bro, thanks again for this script. But I think when on a daily TF, the gap line does not plot.

As below image.


Cheers
Hmm. I hadn't intended it to be used on a daily timeframe. But if you replace the following line:

def Today = GetLastDay() == GetDay();

with

input onDaily = no;
def Today = if onDaily then GetLastWeek() == GetWeek() else GetLastDay() == GetDay();

And then turn that option to yes, it should print the lines across the current week. Good luck!
Noted bro. Thank you. Cheers
 
been struggling with getting any results to show... I have tried changing the values of these lines mentioned above but I am not a coder at all- just trying things. I would like all plots for included aggregation to plot and stay... and I dont know what to change to make that happen . Here is the code I think needs adjusting. there are 10 weeks referenced like week one in the code..
Anyone can help?
input plotLines = yes;
def Today = GetLastDay() == GetDay();
input showOnRight = yes;
def exp = if showOnRight then IsNaN(close[1]) else no;

plot week1 = if exp and Today and plotLines then prevWeeklyClose else Double.NaN;
week1.setDefaultColor(GlobalColor("weekly"));
week1.setLineWeight(2);
week1.hideBubble();
 
  • Love
Reactions: IPA
been struggling with getting any results to show... I have tried changing the values of these lines mentioned above but I am not a coder at all- just trying things. I would like all plots for included aggregation to plot and stay... and I dont know what to change to make that happen . Here is the code I think needs adjusting. there are 10 weeks referenced like week one in the code..
Anyone can help?
input plotLines = yes;
def Today = GetLastDay() == GetDay();
input showOnRight = yes;
def exp = if showOnRight then IsNaN(close[1]) else no;

plot week1 = if exp and Today and plotLines then prevWeeklyClose else Double.NaN;
week1.setDefaultColor(GlobalColor("weekly"));
week1.setLineWeight(2);
week1.hideBubble();
I'm not sure I understand what you are trying to do - add more lines to show 10 weeks? Or are you having trouble getting the existing study to work?
 
Is there a way to create a scan for price touching the halfway point of the current weeks gap?
 

Attachments

  • 2023-05-22-TOS_CHARTS.jpg
    2023-05-22-TOS_CHARTS.jpg
    182.6 KB · Views: 149
Last edited:
Is there a way to create a scan for price touching the halfway point of the current weeks gap?

This is an MTF indicator.

MTF scripts are not allowed in the scanner, watchlists, or conditional orders
It is because of the fundamental way that the condition wizard works.
In the condition wizard, before we start to create the condition filters, we choose the aggregation period.
It is locked in.

After that, the scanner executes all filter conditions solely within the aggregation chosen.
If the scanner encounters an aggregation period within the filter script that doesn't match what has already been chosen; it produces the error message: "secondary aggregations not allowed".
 

Join useThinkScript to post your question to a community of 21,000+ developers and traders.

Similar threads

Not the exact question you're looking for?

Start a new thread and receive assistance from our community.

87k+ Posts
456 Online
Create Post

Similar threads

Similar threads

The Market Trading Game Changer

Join 2,500+ subscribers inside the useThinkScript VIP Membership Club
  • Exclusive indicators
  • Proven strategies & setups
  • Private Discord community
  • ‘Buy The Dip’ signal alerts
  • Exclusive members-only content
  • Add-ons and resources
  • 1 full year of unlimited support

Frequently Asked Questions

What is useThinkScript?

useThinkScript is the #1 community of stock market investors using indicators and other tools to power their trading strategies. Traders of all skill levels use our forums to learn about scripting and indicators, help each other, and discover new ways to gain an edge in the markets.

How do I get started?

We get it. Our forum can be intimidating, if not overwhelming. With thousands of topics, tens of thousands of posts, our community has created an incredibly deep knowledge base for stock traders. No one can ever exhaust every resource provided on our site.

If you are new, or just looking for guidance, here are some helpful links to get you started.

What are the benefits of VIP Membership?
VIP members get exclusive access to these proven and tested premium indicators: Buy the Dip, Advanced Market Moves 2.0, Take Profit, and Volatility Trading Range. In addition, VIP members get access to over 50 VIP-only custom indicators, add-ons, and strategies, private VIP-only forums, private Discord channel to discuss trades and strategies in real-time, customer support, trade alerts, and much more. Learn all about VIP membership here.
How can I access the premium indicators?
To access the premium indicators, which are plug and play ready, sign up for VIP membership here.
Back
Top