Bingy
Member
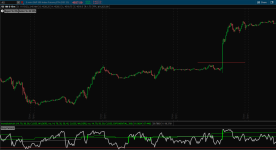
Here is an indictor I created and have been toying around with for a while now. It's my unique take on the traditional RSI and it essentially seeks to find strong long positions. Like big moves, not tiny ones. The point is to wait until there has been a long period of all grey lines, then to wait for the first time all 3 lines go green simultaneously in live time and for the top left to say "HULK SMASH". Then waiting for that current candle to close. It uses MTF's, so it repaints, making it difficult to back-test, but you can most certainly use the "OnDemand" feature to see how it operates. There are other potential uses for this that aren't hard coded in to generate signals. Looking at it long enough may help to reveal something. It works best on the 15min time-frame. Enjoy!
Code:
declare lower;


###################
#Four Hour RSI
###################

input length_Fourhour = 14;
input over_Bought_Fourhour = 70;
input over_Sold_Fourhour = 38;
input power = 42; #50
input price_Fourhour = close;
input averageType_FourHour = AverageType.WILDERS;
input showBreakoutSignals_Fourhour = no;

def FourhourClose = close(period = AggregationPeriod.FOUR_HOURS);
def NetChgAvg = MovingAverage(averageType_FourHour, FourhourClose - FourhourClose[1], length_Fourhour);
def TotChgAvg = MovingAverage(averageType_FourHour, AbsValue(FourhourClose - FourhourClose[1]), length_Fourhour);
def ChgRatio = if TotChgAvg != 0 then NetChgAvg / TotChgAvg else 0;

def RSI_Fourhour = 50 * (ChgRatio + 1);


####################
#DAILY RSI
####################

input length_Daily = 14;
input over_Bought_Daily = 70;
input over_Sold_Daily = 35;
input powerline = 50;
input DailyMiddleLine = 45;
input price_Daily = close;
input averageType_Daily = AverageType.WILDERS;
input showBreakoutSignals_Daily = no;

def DailyClose = close(period = AggregationPeriod.DAY);
def DAILYNetChgAvg = MovingAverage(averageType_Daily, DailyClose - DailyClose[1], length_Daily);
def DAILYTotChgAvg = MovingAverage(averageType_Daily, AbsValue(DailyClose - DailyClose[1]), length_Daily);
def DAILYChgRatio = if DAILYTotChgAvg != 0 then DAILYNetChgAvg / DAILYTotChgAvg else 0;

def RSI_Daily = 50 * (DAILYChgRatio + 1);
def OverSold_Daily = over_Sold_Daily;
def OverBought_Daily = over_Bought_Daily;
def DailyMid = DailyMiddleLine;
def Dailypowerline = powerline;

################
#Regular RSI
################

input RSIlength = 14;
input over_Bought = 70;
input Mid_line = 50;
input over_Sold = 30;
input RSIprice = close;
input RSIaverageType = AverageType.EXPONENTIAL;

def RegularNetChgAvg = MovingAverage(RSIaverageType, RSIprice - RSIprice[1], RSIlength);
def RegularTotChgAvg = MovingAverage(RSIaverageType, AbsValue(RSIprice - RSIprice[1]), RSIlength);
def RegularChgRatio = if RegularTotChgAvg != 0 then RegularNetChgAvg / RegularTotChgAvg else 0;

def RSI = 50 * (RegularChgRatio + 1);

def RSIPlot = RSI;
def RSIOverSold = over_Sold;
def RSIOverBought = over_Bought;
def Midline = Mid_line;

# Calculate SMA of RSI values
input SMA_length = 5;
def RSI_SMA = MovingAverage(RSIaverageType, RSI, SMA_length);

def RSISMAPlot = RSI_SMA;

##################
#Plots
##################


# Plot the RSI lines
plot RSI_Fourhour_Line = RSI_Fourhour;
RSI_Fourhour_Line.AssignValueColor(if RSI_Daily > Dailypowerline and RSI_Fourhour > power and RSI_Fourhour > RSI_Daily then Color.GREEN else GetColor(3));  # Change color to your preference

plot RSI_Daily_Line = RSI_Daily;
RSI_Daily_Line.AssignValueColor(if RSI_Daily > Dailypowerline then Color.GREEN else GetColor(3));

def RSI_Change = RSI - RSI[1];

# Define the condition for RSI_Daily increase by 5.75 or more
def RSI_Increase = RSI_Change >= 10.00;


plot RSI_Regular_Line = RSIPlot;
RSI_Regular_Line.AssignValueColor(if RSI_Daily > Dailypowerline and RSI_Fourhour > power and RSI_Fourhour > RSI_Daily and RSI > RSI_Daily and RSI > RSI_Fourhour and RSI_Increase then Color.GREEN else GetColor(3));  # Change color to your preference
RSI_Regular_Line.SetLineWeight(2);  # Adjust the width as needed


def HulkSmash = RSI_Daily > Dailypowerline and RSI_Fourhour > power and RSI_Fourhour > RSI_Daily and RSI > RSI_Daily and RSI > RSI_Fourhour and RSI_Increase;

def Not_HulkSmash = !RSI_Daily > Dailypowerline and RSI_Fourhour > power and RSI_Fourhour > RSI_Daily and RSI > RSI_Daily and RSI > RSI_Fourhour and RSI_Increase;

AddLabel(yes, if HulkSmash then "HULK SMASH!" else if Not_HulkSmash then "Stay Patient" else "Stay Patient", if HulkSmash then Color.GREEN else if Not_HulkSmash then Color.GRAY else Color.GRAY);

# Define the buy conditions
def buyCondition = RSI_Fourhour < over_Sold_Fourhour &&
                  RSI_Daily < over_Sold_Daily &&
                  RSIPlot crosses above RSIOversold;

# Plot a marker when the buy conditions are met
#plot BuySignal = buyCondition;
#BuySignal.SetPaintingStrategy(PaintingStrategy.BOOLEAN_ARROW_UP);
#BuySignal.SetDefaultColor(Color.GREEN);
#BuySignal.SetLineWeight(2);
Last edited: