Moving Average Crossovers For ThinkOrSwim

What makes you think there is something wrong with your script?
In order to troubleshoot the issues. We need to be able to see what you are seeing. So we need you to provide a screen grab of the wonky results. Make sure to grab the whole chart so we can see the aggregations, what stock, and all your settings so we can try to replicate your results and correct them.
After you post the above information, I am sure someone will be able to point you toward possible solutions and a watchlist.
Unsure of how to upload screenshots to the forum, Here are directions.
Hi,
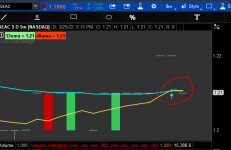
I setup the script, however it didn't notify me a bar prior to the ema crossover, it was when the crossover happened. Please see attached screenshot and my script.
input EMAPeriod1 = 13;
input EMAPeriod2 = 48;
input price = close;
def na = double.nan;

plot ema1 = ExpAverage(price, EMAPeriod1);
plot ema2 = ExpAverage(price, EMAPeriod2);

def crossover_1_2 = if ema1 > ema2 AND ema1[1] <= ema2[1] then 1 else 0;
def crossunder_1_2 = if ema1 < ema2 AND ema1[1] >= ema2[1] then 1 else 0;

#Plot arrows

Plot up = if (crossover_1_2) then low – tickSize() else na;
Plot down = if (crossunder_1_2) then high + tickSize() else na; up.SetPaintingStrategy(paintingStrategy.ARROW_UP); down.SetPaintingStrategy(paintingStrategy.ARROW_DOWN);

#Trigger alerts
alert(crossover_1_2[1], “Crossover_1_2”, Alert.Bar, Sound.Ding);
alert(crossunder_1_2[1], “Crossunder_1_2”, Alert.Bar, Sound.Ding);
14151[/ATTACH]']
1TtVv06.png
 

Attachments

  • 1TtVv06.png
    1TtVv06.png
    32.5 KB · Views: 218
Hi,
I setup the script, however it didn't notify me a bar prior to the ema crossover, it was when the crossover happened. Please see attached screenshot and my script.
input EMAPeriod1 = 13;
input EMAPeriod2 = 48;
input price = close;
def na = double.nan;

plot ema1 = ExpAverage(price, EMAPeriod1);
plot ema2 = ExpAverage(price, EMAPeriod2);

def crossover_1_2 = if ema1 > ema2 AND ema1[1] <= ema2[1] then 1 else 0;
def crossunder_1_2 = if ema1 < ema2 AND ema1[1] >= ema2[1] then 1 else 0;

#Plot arrows

Plot up = if (crossover_1_2) then low – tickSize() else na;
Plot down = if (crossunder_1_2) then high + tickSize() else na; up.SetPaintingStrategy(paintingStrategy.ARROW_UP); down.SetPaintingStrategy(paintingStrategy.ARROW_DOWN);

#Trigger alerts
alert(crossover_1_2[1], “Crossover_1_2”, Alert.Bar, Sound.Ding);
alert(crossunder_1_2[1], “Crossunder_1_2”, Alert.Bar, Sound.Ding);
These are variables written to look into the FUTURE:
Rich (BB code):
def crossover_1_2 = if ema1 > ema2 AND ema1[1] <= ema2[1] then 1 else 0;
def crossunder_1_2 = if ema1 < ema2 AND ema1[1] >= ema2[1] then 1 else 0;

Coding with future bars adds at least a 2-bar lag. As they have to wait until the FUTURE BAR closes before they will trigger.
Future bars can be useful, when you want a script to wait for an additional confirming signal. However, given that moving averages already lag 1/2 their length, future bars would be contra-indicated.
@henry1224
 
Last edited:
These are variables written to look into the FUTURE:
Rich (BB code):
def crossover_1_2 = if ema1 > ema2 AND ema1[1] <= ema2[1] then 1 else 0;
def crossunder_1_2 = if ema1 < ema2 AND ema1[1] >= ema2[1] then 1 else 0;

Coding with future bars adds at least a 2-bar lag. As they have to wait until the FUTURE BAR closes before they will trigger.
Future bars can be useful, when you want a script to wait for an additional confirming signal. However, given that moving averages already lag 1/2 their length, future bars would be contra-indicated.
@henry1224
Thank you!!
I will update that to my studies. I guess Im confused b/c I have a difference script for the scans which alerts my phone. I a study, scan and watchlist w/ the study column.
This is what I have in my scan. In the column watchlist, I have a diff script to identify when the ema13 crosses above ema48 its bullish and the inverse is bearish. I want to remove the crosses above/below, but no option for it, it's when the cross in general. Could I post here b/c it goes with the theme of crossover moving avgs?

#9EMA crosses over 21EMA, with the condition of current price is above 50EMA and 200EMA.21EMA

def sma200 = simplemovingavg(close, 200);
def sma50 = simplemovingavg(close, 50);
def ema48 = ExpAverage(close, 48);
def ema13 = ExpAverage(close, 13);
plot scan = ema13 crosses above ema48 and close > sma200 and close > sma50 ;

def lookback = 1;
def EMA1 = ExpAverage(close, 13);
def EMA2 = ExpAverage(close,48)[lookback];
Are you asking a question?
The script you posted is a scan. It looks for instruments that:
plot scan = ema13 crosses above ema48 and close > sma200 and close > sma50 ;
This says: where sma200 and sma50 are greater than price, trigger when ema13 crosses ema48.

These lines do nothing:
def lookback = 1;
def EMA1 = ExpAverage(close, 13);
def EMA2 = ExpAverage(close,48)[lookback];


From what I think I understand, you would like a script that signals before the cross. You understand that would take a crystal ball.
The workaround favored by most members:
https://usethinkscript.com/threads/moving-average-crossovers-for-thinkorswim.229/page-14#post-94461
 
Hi everyone,
I am using a simple code to check for the latest cross above and cross as below. It gives me the bars from today to the latest cross above correctly. However, when i change the ">" to "<" in order to get the cross below, it gives me 0.
Any suggestion?

~~~~~
input SMA1 = 10;
input SMA2 = 20;
input price = close;

Plot avgsma1 = Average(price, SMA1);
Plot avgsma2 = Average(price, SMA2);

def above = avgsma1 crosses above avgsma2;
def below = avgsma1 crosses below avgsma2;
plot daysfromcrossAbove = fold i = 0 to 1000 with c = 0 while GetValue(avgsma1, c) > GetValue(avgsma2, c) do c + 1;
#plot daysfromcrossAbove = fold i = 0 to 1000 with c = 0 while avgsma1 > avgsma2 do c + 1;
AddLabel (yes, "Bars Since " + ":" + daysfromcrossAbove );
 
@KLMS Your FOLD and Label are only displaying current bar state, so if avgsma1 is 'greater than' avgsma2 on the current bar and you are checking for 'less than' then it will return 0.
Your wanting to see how many bars from the last cross up or cross down.
Just use two counters that increment by one every bar and reset upon cross up or down.


6UP444N.png

Ruby:
input SMA1 = 10;
input SMA2 = 20;
input price = close;

Plot avgsma1 = Average(price, SMA1);
Plot avgsma2 = Average(price, SMA2);

def above = if avgsma1 crosses above avgsma2 then 1 else above[1]+1;
def below = if avgsma1 crosses below avgsma2 then 1 else below[1]+1;

AddLabel (yes, "Bars Since Cross Above" + ":" + above,color.WHITE);
AddLabel (yes, "Bars Since Cross Below" + ":" + below,color.WHITE);
@Svanoy , thanks. It works exactly what i want.
Now i am trying to get the lowest price between above and below.
However, it is not working. Do you have any advise for me?

input SMA1 = 10;
input SMA2 = 20;
input price = close;

plot avgsma1 = Average(price, SMA1);
plot avgsma2 = Average(price, SMA2);

def above = if avgsma1 crosses above avgsma2 then 1 else above[1]+1;
def below = if avgsma1 crosses below avgsma2 then 1 else below[1]+1;

plot LL = (fold n = above to below with s
do
if getvalue(low, n) < getvalue(low,n+1) then
(
s==getvalue(low,n)
)
else
(
s==getvalue(low,n+1)
)
);

AddLabel (yes, "Bars Since Cross Above" + ":" + above,color.WHITE);
AddLabel (yes, "Bars Since Cross Below" + ":" + below,color.WHITE);
AddLabel (yes, "Lowest" + ":" + LL);
 
@KLMS I left in the plot line just for visual verification.

DfV4oHm.png

Ruby:
input SMA1 = 10;
input SMA2 = 20;
input price = close;

plot avgsma1 = Average(price, SMA1);
plot avgsma2 = Average(price, SMA2);

def above = if avgsma1 crosses above avgsma2 then 1 else above[1]+1;
def below = if avgsma1 crosses below avgsma2 then 1 else below[1]+1;

def LL;
if above == 1 {
LL = low;
} else if avgsma1 < avgsma2 {
LL = LL[1];
} else if low < LL[1] {
LL = low;
} else {
LL = LL[1];}

plot LLP = LL;

AddLabel (yes, "Bars Since Cross Above" + ":" + above,color.WHITE);
AddLabel (yes, "Bars Since Cross Below" + ":" + below,color.WHITE);
AddLabel (yes, "Lowest" + ":" + LL,color.WHITE);
 
Thanks @Svanoy . If i need only the Lowest value of the "latest" 10SMA cross below 20SMA and then cross above again. How can i do that?

I only need the last pair and don't need the older cross over. And i only want when it is cross below and then cross above again and don't want the one that cross above and then cross below. That is, i look at the uptrend in general.

I have tried to tweak a little bit with your suggested code but still not getting what I need.
Sorry for my dumb questions.
 
@KLMS I think this what you are describing?
Ruby:
input SMA1 = 10;
input SMA2 = 20;
input price = close;

plot avgsma1 = Average(price, SMA1);
plot avgsma2 = Average(price, SMA2);

def above = if avgsma1 crosses above avgsma2 then 1 else above[1]+1;
def below = if avgsma1 crosses below avgsma2 then 1 else below[1]+1;

def LLWB;
if below == 1 {
LLWB = low;
} else if avgsma1 > avgsma2 {
LLWB = LLWB[1];
} else if low < LLWB[1] {
LLWB = low;
} else {
LLWB = LLWB[1];}

def LL = if above == 1 then LLWB else LL[1];

plot LLP = LL;

AddLabel (yes, "Bars Since Cross Above" + ":" + above,color.WHITE);
AddLabel (yes, "Bars Since Cross Below" + ":" + below,color.WHITE);
AddLabel (yes, "Lowest" + ":" + LL,color.WHITE);
 
Last edited:
@KLMS I think this what you are describing?
Ruby:
input SMA1 = 10;
input SMA2 = 20;
input price = close;

plot avgsma1 = Average(price, SMA1);
plot avgsma2 = Average(price, SMA2);

def above = if avgsma1 crosses above avgsma2 then 1 else above[1]+1;
def below = if avgsma1 crosses below avgsma2 then 1 else below[1]+1;

def LLWB;
if below == 1 {
LLWB = low;
} else if avgsma1 > avgsma2 {
LLWB = LLWB[1];
} else if low < LLWB[1] {
LLWB = low;
} else {
LLWB = LLWB[1];}

def LL = if above == 1 then LLWB else LL[1];

plot LLP = LL;

AddLabel (yes, "Bars Since Cross Above" + ":" + above,color.WHITE);
AddLabel (yes, "Bars Since Cross Below" + ":" + below,color.WHITE);
AddLabel (yes, "Lowest" + ":" + LL,color.WHITE);
Thank @Svanoy. It works on the chart perfectly.
But when I add the same code to a custom column, most of the stocks works fine. However, for stock GD, the custom column gives me $234.13. But the chart does plot the right value $232.87.

Any idea? Really appreciate your great help.
 
Thank @Svanoy. It works on the chart perfectly.
But when I add the same code to a custom column, most of the stocks works fine. However, for stock GD, the custom column gives me $234.13. But the chart does plot the right value $232.87.

Any idea? Really appreciate your great help.
"sometimes" it helps to play with turning extended hours on and off on both or one of the watchlist / charts.
 
@Svanoy @MerryDay , i found out why. It is the dividend.

But i don't know why the chart is adjusted while the custom column doesn't.
Pat yourself on the back. It is a process to get scans, charts, watchlists, oco's to reflect the same data… Good job! (y)
 
Last edited:
I'm looking to create a scanner to help with a scalp strategy. I need the scanner to pick up stocks that the xxx SMA crossed above the xxx SMA, easy enough, but I'm looking to find a way that it will scan for that condition within the last xxx bars.... So, example would be the 20 SMA crossed above the 50 SMA within the last 3 bars on a 5 min chart. Is this possible?
HI @darkelvis did you get the scan for this?
 
Hey guys I need your help.. Here is the ToS Moving Average Crossover. I'm trying to have it generate an audible alert and arrow signal to buy and sell. When I apply this script in live, it doesn't generate audible alert. Can anyone please check what is wrong with what I am doing?
...thanks in advance.
Code:
#----------  Inputs

input price = close;
input EMA_1 = 20;
input EMA_2 = 20;
input showBreakoutSignals = no;

plot AvgExp_1 = ExpAverage(price, EMA_1);
plot AvgExp_2 = ExpAverage(AvgExp_1, EMA_2);

DefineGlobalColor("Bullish", Color.GREEN);
DefineGlobalColor("Bearish", Color.RED);
AddCloud(AvgExp_1, AvgExp_2, GlobalColor("Bullish"), GlobalColor("Bearish"));

#---------- Signals Section

def emaCrossingAbove =  AvgExp_1[1] < AvgExp_2[1] and  AvgExp_1 > AvgExp_2;
def smaCrossingBelow =  AvgExp_1[1] > AvgExp_2[1] and  AvgExp_1 < AvgExp_2;

#---------- Plots Section

plot crossingAbove = emaCrossingAbove[-1];
crossingAbove.SetPaintingStrategy(PaintingStrategy.BOOLEAN_ARROW_UP);
crossingAbove.SetDefaultColor(Color.CYAN);
crossingAbove.SetLineWeight(3);
plot crossingBelow = smaCrossingBelow[-1];
crossingBelow.SetPaintingStrategy(PaintingStrategy.BOOLEAN_ARROW_DOWN);
crossingBelow.SetDefaultColor(Color.MAGENTA);
crossingBelow.SetLineWeight(3);

#---------- Alerts Section

Alert(crossingAbove, "EMA Crossing Above", Alert.BAR, Sound.RING);
Alert(crossingBelow, "EMA Crossing Below", Alert.BAR, Sound.RING);
 
Last edited by a moderator:
Hey guys I need your help.. Here is the ToS Moving Average Crossover. I'm trying to have it generate an audible alert and arrow signal to buy and sell. When I apply this script in live, it doesn't generate audible alert. Can anyone please check what is wrong with what I am doing?
...thanks in advance.
Code:
#----------  Inputs

input price = close;
input EMA_1 = 20;
input EMA_2 = 20;
input showBreakoutSignals = no;

plot AvgExp_1 = ExpAverage(price, EMA_1);
plot AvgExp_2 = ExpAverage(AvgExp_1, EMA_2);

DefineGlobalColor("Bullish", Color.GREEN);
DefineGlobalColor("Bearish", Color.RED);
AddCloud(AvgExp_1, AvgExp_2, GlobalColor("Bullish"), GlobalColor("Bearish"));

#---------- Signals Section

def emaCrossingAbove =  AvgExp_1[1] < AvgExp_2[1] and  AvgExp_1 > AvgExp_2;
def smaCrossingBelow =  AvgExp_1[1] > AvgExp_2[1] and  AvgExp_1 < AvgExp_2;

#---------- Plots Section

plot crossingAbove = emaCrossingAbove[-1];
crossingAbove.SetPaintingStrategy(PaintingStrategy.BOOLEAN_ARROW_UP);
crossingAbove.SetDefaultColor(Color.CYAN);
crossingAbove.SetLineWeight(3);
plot crossingBelow = smaCrossingBelow[-1];
crossingBelow.SetPaintingStrategy(PaintingStrategy.BOOLEAN_ARROW_DOWN);
crossingBelow.SetDefaultColor(Color.MAGENTA);
crossingBelow.SetLineWeight(3);

#---------- Alerts Section

Alert(crossingAbove, "EMA Crossing Above", Alert.BAR, Sound.RING);
Alert(crossingBelow, "EMA Crossing Below", Alert.BAR, Sound.RING);
Alerts sound on the current bar. Your crossover is looking at the previous bar.
Alerts cannot go back in history to alert.
 
Hey guys, not sure if anyone has links to scanners like QULLAMAGGIE has.

But if not and if someone can make one I would really appreciate it.

Looking for one that finds stocks that the 50 day is over the 200 day moving average.

Heres a link qullamaggie.com/my-3-timeless-setups-that-have-made-me-tens-of-millions/

Anyways would really appreciate it. Thanks in advance.
 

Join useThinkScript to post your question to a community of 21,000+ developers and traders.

Similar threads

Not the exact question you're looking for?

Start a new thread and receive assistance from our community.

87k+ Posts
333 Online
Create Post

Similar threads

Similar threads

The Market Trading Game Changer

Join 2,500+ subscribers inside the useThinkScript VIP Membership Club
  • Exclusive indicators
  • Proven strategies & setups
  • Private Discord community
  • ‘Buy The Dip’ signal alerts
  • Exclusive members-only content
  • Add-ons and resources
  • 1 full year of unlimited support

Frequently Asked Questions

What is useThinkScript?

useThinkScript is the #1 community of stock market investors using indicators and other tools to power their trading strategies. Traders of all skill levels use our forums to learn about scripting and indicators, help each other, and discover new ways to gain an edge in the markets.

How do I get started?

We get it. Our forum can be intimidating, if not overwhelming. With thousands of topics, tens of thousands of posts, our community has created an incredibly deep knowledge base for stock traders. No one can ever exhaust every resource provided on our site.

If you are new, or just looking for guidance, here are some helpful links to get you started.

What are the benefits of VIP Membership?
VIP members get exclusive access to these proven and tested premium indicators: Buy the Dip, Advanced Market Moves 2.0, Take Profit, and Volatility Trading Range. In addition, VIP members get access to over 50 VIP-only custom indicators, add-ons, and strategies, private VIP-only forums, private Discord channel to discuss trades and strategies in real-time, customer support, trade alerts, and much more. Learn all about VIP membership here.
How can I access the premium indicators?
To access the premium indicators, which are plug and play ready, sign up for VIP membership here.
Back
Top