
@samer800 it you add MTF and the cloud in between the averages green and red? thanksfind below
CSS:#// This source code is subject to the terms of the Mozilla Public License 2.0 at https://mozilla.org/MPL/2.0/ #// © rouxam #// This simple study generates alerts for buying at MA Crossover in 3commas #// The alerts are best combined with a DCA bot like 3commas. #// This works very well on sideways markets with small Take Profits <= 0.6% #study("MA Crossover Buy Alerts", shorttitle="MA crossover", overlay=true) # converted by Sam4Cok@Samer800 - request from useThinkScript.com member - 06/2023 input ma_type = {SMA, EMA, WMA, HullMA, VWMA, RMA, default TEMA}; input slow_ma_period = 100;#, minval=30, maxval=200, title="Slow MA Period") input fast_ma_period = 20;#, minval=5, maxval=40, title="Fast MA Period") def na = Double.NaN; #get_ma(src, ma_type, len) => script get_ma { input src = close; input ma_type = "TEMA"; input len = 100; def hullma = HullMovingAvg(src, len); def vwma = Average(src * volume, len) / Average(volume, len); def ema1 = ExpAverage(src, len); def ema2 = ExpAverage(ema1, len); def ema3 = ExpAverage(ema2, len); def tema = 3 * (ema1 - ema2) + ema3; def ma = if ma_type == "SMA" then Average(src, len) else if ma_type == "EMA" then ExpAverage(src, len) else if ma_type == "WMA" then WMA(src, len) else if ma_type == "HullMA" then hullma else if ma_type == "VWMA" then vwma else if ma_type == "RMA" then WildersAverage(src, len) else tema; plot out = ma; } #// Calculate Fast and Slow Moving averages def fast_ma = get_ma(close, ma_type, fast_ma_period); def slow_ma = get_ma(close, ma_type, slow_ma_period); def slow_ma_up = slow_ma >= slow_ma[1]; #// Buy signal: MA Crossover, with slow MA trending upwards def buy = crosses(fast_ma, slow_ma, CrossingDirection.ABOVE) and slow_ma_up; #// Low-pass filter to avoid generating too many consecutive orders def checkbuy = buy and !buy[1] and !buy[2] and !buy[3] and !buy[4] and !buy[5] and !buy[6]; def buy_signal = checkbuy; #// Plot color: Green if fast MA higher than slow MA def col = fast_ma >= slow_ma; plot FastMovingAverage = fast_ma;#, title="Fast Moving Average", linewidth=3, color=color_uptrend) plot SlowMovingAverage = slow_ma;#, title="Slow Moving Average", linewidth=1, color=color_uptrend) FastMovingAverage.SetLineWeight(2); FastMovingAverage.AssignValueColor(if col then Color.GREEN else Color.RED); SlowMovingAverage.AssignValueColor(if col then Color.GREEN else Color.RED); AddChartBubble(buy_signal, low, "Buy", Color.GREEN, no);# shape.labelup, location.belowbar, color=color.teal, size=size.small) #-- END of CODE
You are using an out of date browser. It may not display this or other websites correctly.
You should upgrade or use an alternative browser.
You should upgrade or use an alternative browser.
here we go.@samer800 it you add MTF and the cloud in between the averages green and red? thanks
CSS:
#// This source code is subject to the terms of the Mozilla Public License 2.0 at https://mozilla.org/MPL/2.0/
#// © rouxam
#// This simple study generates alerts for buying at MA Crossover in 3commas
#// The alerts are best combined with a DCA bot like 3commas.
#// This works very well on sideways markets with small Take Profits <= 0.6%
#study("MA Crossover Buy Alerts", shorttitle="MA crossover", overlay=true)
# converted by Sam4Cok@Samer800 - request from useThinkScript.com member - 06/2023
# update - added MTF option by Sam4Cok@Samer800    - 06/2023;
input ma_type         = {SMA, EMA, WMA, HullMA, VWMA, RMA, default TEMA};
input useChartTimeframeForSlowMa = {Default "Yes", "No"};
input manualSlowMaTimeframe = AggregationPeriod.FIFTEEN_MIN;
input slow_ma_period  = 100;    # "Slow MA Period"
input useChartTimeframeForFastMa = {Default "Yes", "No"};
input manualFastMaTimeframe = AggregationPeriod.FIFTEEN_MIN;
input fast_ma_period  = 20;     # "Fast MA Period"

def na = Double.NaN;
def c; def v;
def c1; def v1;

switch (useChartTimeframeForSlowMa) {
case "Yes" :
       c = close;
       v = volume;
case "No" :
       c = close(Period=manualSlowMaTimeframe);
       v = volume(Period=manualSlowMaTimeframe);
}
switch (useChartTimeframeForFastMa) {
case "Yes" :
       c1 = close;
       v1 = volume;
case "No" :
       c1 = close(Period=manualFastMaTimeframe);
       v1 = volume(Period=manualFastMaTimeframe);
}

#get_ma(src, ma_type, len) =>
script get_ma {
    input src = close;
    input ma_type = "TEMA";
    input len = 100;
    input v = Volume;
    def hullma = HullMovingAvg(src, len);
    def vwma = Average(src * v, len) / Average(v, len);
    def ema1 = ExpAverage(src, len);
    def ema2 = ExpAverage(ema1, len);
    def ema3 = ExpAverage(ema2, len);
    def tema = 3 * (ema1 - ema2) + ema3;
    def ma = if ma_type == "SMA" then Average(src, len) else
        if ma_type == "EMA" then ExpAverage(src, len)   else
            if ma_type == "WMA" then WMA(src, len) else
                if ma_type == "HullMA" then hullma else
                    if ma_type == "VWMA" then vwma else
                        if ma_type == "RMA" then WildersAverage(src, len) else tema;
    plot out = ma;
}

#// Calculate Fast and Slow Moving averages
def fast_ma = get_ma(c1, ma_type, fast_ma_period, v1);
def slow_ma = get_ma(c, ma_type, slow_ma_period, v);
def slow_ma_up = slow_ma >= slow_ma[1];

#// Buy signal: MA Crossover, with slow MA trending upwards
def buy = crosses(fast_ma, slow_ma, CrossingDirection.ABOVE) and slow_ma_up;

#// Low-pass filter to avoid generating too many consecutive orders
def checkbuy = buy and !buy[1] and !buy[2] and !buy[3] and !buy[4] and !buy[5] and !buy[6];
def buy_signal = checkbuy;


#// Plot color: Green if fast MA higher than slow MA
def col = fast_ma >= slow_ma;
plot FastMovingAverage = fast_ma;#, title="Fast Moving Average", linewidth=3, color=color_uptrend)
plot SlowMovingAverage = slow_ma;#, title="Slow Moving Average", linewidth=1, color=color_uptrend)

FastMovingAverage.SetLineWeight(2);
FastMovingAverage.AssignValueColor(if col then Color.GREEN else Color.RED);
SlowMovingAverage.AssignValueColor(if col then Color.GREEN else Color.RED);

AddChartBubble(buy_signal, low, "Buy",  Color.GREEN, no);# shape.labelup, location.belowbar, color=color.teal,  size=size.small)


#-- END of CODEThere’s only one signal but Could you add the sell signal?here we go.
CSS:#// This source code is subject to the terms of the Mozilla Public License 2.0 at https://mozilla.org/MPL/2.0/ #// © rouxam #// This simple study generates alerts for buying at MA Crossover in 3commas #// The alerts are best combined with a DCA bot like 3commas. #// This works very well on sideways markets with small Take Profits <= 0.6% #study("MA Crossover Buy Alerts", shorttitle="MA crossover", overlay=true) # converted by Sam4Cok@Samer800 - request from useThinkScript.com member - 06/2023 # update - added MTF option by Sam4Cok@Samer800 - 06/2023; input ma_type = {SMA, EMA, WMA, HullMA, VWMA, RMA, default TEMA}; input useChartTimeframeForSlowMa = {Default "Yes", "No"}; input manualSlowMaTimeframe = AggregationPeriod.FIFTEEN_MIN; input slow_ma_period = 100; # "Slow MA Period" input useChartTimeframeForFastMa = {Default "Yes", "No"}; input manualFastMaTimeframe = AggregationPeriod.FIFTEEN_MIN; input fast_ma_period = 20; # "Fast MA Period" def na = Double.NaN; def c; def v; def c1; def v1; switch (useChartTimeframeForSlowMa) { case "Yes" : c = close; v = volume; case "No" : c = close(Period=manualSlowMaTimeframe); v = volume(Period=manualSlowMaTimeframe); } switch (useChartTimeframeForFastMa) { case "Yes" : c1 = close; v1 = volume; case "No" : c1 = close(Period=manualFastMaTimeframe); v1 = volume(Period=manualFastMaTimeframe); } #get_ma(src, ma_type, len) => script get_ma { input src = close; input ma_type = "TEMA"; input len = 100; input v = Volume; def hullma = HullMovingAvg(src, len); def vwma = Average(src * v, len) / Average(v, len); def ema1 = ExpAverage(src, len); def ema2 = ExpAverage(ema1, len); def ema3 = ExpAverage(ema2, len); def tema = 3 * (ema1 - ema2) + ema3; def ma = if ma_type == "SMA" then Average(src, len) else if ma_type == "EMA" then ExpAverage(src, len) else if ma_type == "WMA" then WMA(src, len) else if ma_type == "HullMA" then hullma else if ma_type == "VWMA" then vwma else if ma_type == "RMA" then WildersAverage(src, len) else tema; plot out = ma; } #// Calculate Fast and Slow Moving averages def fast_ma = get_ma(c1, ma_type, fast_ma_period, v1); def slow_ma = get_ma(c, ma_type, slow_ma_period, v); def slow_ma_up = slow_ma >= slow_ma[1]; #// Buy signal: MA Crossover, with slow MA trending upwards def buy = crosses(fast_ma, slow_ma, CrossingDirection.ABOVE) and slow_ma_up; #// Low-pass filter to avoid generating too many consecutive orders def checkbuy = buy and !buy[1] and !buy[2] and !buy[3] and !buy[4] and !buy[5] and !buy[6]; def buy_signal = checkbuy; #// Plot color: Green if fast MA higher than slow MA def col = fast_ma >= slow_ma; plot FastMovingAverage = fast_ma;#, title="Fast Moving Average", linewidth=3, color=color_uptrend) plot SlowMovingAverage = slow_ma;#, title="Slow Moving Average", linewidth=1, color=color_uptrend) FastMovingAverage.SetLineWeight(2); FastMovingAverage.AssignValueColor(if col then Color.GREEN else Color.RED); SlowMovingAverage.AssignValueColor(if col then Color.GREEN else Color.RED); AddChartBubble(buy_signal, low, "Buy", Color.GREEN, no);# shape.labelup, location.belowbar, color=color.teal, size=size.small) #-- END of CODE
it is buy signal indicator. anyway, I added sell signal from the same code concept. You may need to test it further.There’s only one signal but Could you add the sell signal?
CSS:
#// This source code is subject to the terms of the Mozilla Public License 2.0 at https://mozilla.org/MPL/2.0/
#// © rouxam
#// This simple study generates alerts for buying at MA Crossover in 3commas
#// The alerts are best combined with a DCA bot like 3commas.
#// This works very well on sideways markets with small Take Profits <= 0.6%
#study("MA Crossover Buy Alerts", shorttitle="MA crossover", overlay=true)
# converted by Sam4Cok@Samer800 - request from useThinkScript.com member - 06/2023
# update - added MTF option and Sell Signals by Sam4Cok@Samer800    - 06/2023;
input ma_type         = {SMA, EMA, WMA, HullMA, VWMA, RMA, default TEMA};
input useChartTimeframeForSlowMa = {Default "Yes", "No"};
input manualSlowMaTimeframe = AggregationPeriod.FIFTEEN_MIN;
input slow_ma_period  = 100;    # "Slow MA Period"
input useChartTimeframeForFastMa = {Default "Yes", "No"};
input manualFastMaTimeframe = AggregationPeriod.FIFTEEN_MIN;
input fast_ma_period  = 20;     # "Fast MA Period"

def na = Double.NaN;
def c; def v;
def c1; def v1;

switch (useChartTimeframeForSlowMa) {
case "Yes" :
       c = close;
       v = volume;
case "No" :
       c = close(Period=manualSlowMaTimeframe);
       v = volume(Period=manualSlowMaTimeframe);
}
switch (useChartTimeframeForFastMa) {
case "Yes" :
       c1 = close;
       v1 = volume;
case "No" :
       c1 = close(Period=manualFastMaTimeframe);
       v1 = volume(Period=manualFastMaTimeframe);
}

#get_ma(src, ma_type, len) =>
script get_ma {
    input src = close;
    input ma_type = "TEMA";
    input len = 100;
    input v = Volume;
    def hullma = HullMovingAvg(src, len);
    def vwma = Average(src * v, len) / Average(v, len);
    def ema1 = ExpAverage(src, len);
    def ema2 = ExpAverage(ema1, len);
    def ema3 = ExpAverage(ema2, len);
    def tema = 3 * (ema1 - ema2) + ema3;
    def ma = if ma_type == "SMA" then Average(src, len) else
        if ma_type == "EMA" then ExpAverage(src, len)   else
            if ma_type == "WMA" then WMA(src, len) else
                if ma_type == "HullMA" then hullma else
                    if ma_type == "VWMA" then vwma else
                        if ma_type == "RMA" then WildersAverage(src, len) else tema;
    plot out = ma;
}

#// Calculate Fast and Slow Moving averages
def fast_ma = get_ma(c1, ma_type, fast_ma_period, v1);
def slow_ma = get_ma(c, ma_type, slow_ma_period, v);
def slow_ma_up = slow_ma > slow_ma[1];
def slow_ma_dn = slow_ma < slow_ma[1];
#// Buy signal: MA Crossover, with slow MA trending upwards
def buy = crosses(fast_ma, slow_ma, CrossingDirection.ABOVE) and slow_ma_up;
def sell = crosses(fast_ma, slow_ma, CrossingDirection.BELOW) and slow_ma_dn;
#// Low-pass filter to avoid generating too many consecutive orders
def checkbuy = buy and !buy[1] and !buy[2] and !buy[3] and !buy[4] and !buy[5] and !buy[6];
def checksell = sell and !sell[1] and !sell[2] and !sell[3] and !sell[4] and !sell[5] and !sell[6];
def buy_signal = checkbuy;
def sell_signal = checksell;

#// Plot color: Green if fast MA higher than slow MA
def col = fast_ma >= slow_ma;
plot FastMovingAverage = fast_ma;#, title="Fast Moving Average"
plot SlowMovingAverage = slow_ma;#, title="Slow Moving Average"

FastMovingAverage.SetLineWeight(2);
FastMovingAverage.AssignValueColor(if col then Color.GREEN else Color.RED);
SlowMovingAverage.AssignValueColor(if col then Color.GREEN else Color.RED);

AddChartBubble(buy_signal, low, "Buy",  Color.GREEN, no);
AddChartBubble(sell_signal, high, "Sell",  Color.RED, yes);


#-- END of CODE@samer800 I tested it for $AAPL and $ES futures, and the buy or sell signal doesn't show up, could you take a look, and if possible have the last moving average cross only show the buy and sell? thanks a bunch.it is buy signal indicator. anyway, I added sell signal from the same code concept. You may need to test it further.
CSS:#// This source code is subject to the terms of the Mozilla Public License 2.0 at https://mozilla.org/MPL/2.0/ #// © rouxam #// This simple study generates alerts for buying at MA Crossover in 3commas #// The alerts are best combined with a DCA bot like 3commas. #// This works very well on sideways markets with small Take Profits <= 0.6% #study("MA Crossover Buy Alerts", shorttitle="MA crossover", overlay=true) # converted by Sam4Cok@Samer800 - request from useThinkScript.com member - 06/2023 # update - added MTF option and Sell Signals by Sam4Cok@Samer800 - 06/2023; input ma_type = {SMA, EMA, WMA, HullMA, VWMA, RMA, default TEMA}; input useChartTimeframeForSlowMa = {Default "Yes", "No"}; input manualSlowMaTimeframe = AggregationPeriod.FIFTEEN_MIN; input slow_ma_period = 100; # "Slow MA Period" input useChartTimeframeForFastMa = {Default "Yes", "No"}; input manualFastMaTimeframe = AggregationPeriod.FIFTEEN_MIN; input fast_ma_period = 20; # "Fast MA Period" def na = Double.NaN; def c; def v; def c1; def v1; switch (useChartTimeframeForSlowMa) { case "Yes" : c = close; v = volume; case "No" : c = close(Period=manualSlowMaTimeframe); v = volume(Period=manualSlowMaTimeframe); } switch (useChartTimeframeForFastMa) { case "Yes" : c1 = close; v1 = volume; case "No" : c1 = close(Period=manualFastMaTimeframe); v1 = volume(Period=manualFastMaTimeframe); } #get_ma(src, ma_type, len) => script get_ma { input src = close; input ma_type = "TEMA"; input len = 100; input v = Volume; def hullma = HullMovingAvg(src, len); def vwma = Average(src * v, len) / Average(v, len); def ema1 = ExpAverage(src, len); def ema2 = ExpAverage(ema1, len); def ema3 = ExpAverage(ema2, len); def tema = 3 * (ema1 - ema2) + ema3; def ma = if ma_type == "SMA" then Average(src, len) else if ma_type == "EMA" then ExpAverage(src, len) else if ma_type == "WMA" then WMA(src, len) else if ma_type == "HullMA" then hullma else if ma_type == "VWMA" then vwma else if ma_type == "RMA" then WildersAverage(src, len) else tema; plot out = ma; } #// Calculate Fast and Slow Moving averages def fast_ma = get_ma(c1, ma_type, fast_ma_period, v1); def slow_ma = get_ma(c, ma_type, slow_ma_period, v); def slow_ma_up = slow_ma > slow_ma[1]; def slow_ma_dn = slow_ma < slow_ma[1]; #// Buy signal: MA Crossover, with slow MA trending upwards def buy = crosses(fast_ma, slow_ma, CrossingDirection.ABOVE) and slow_ma_up; def sell = crosses(fast_ma, slow_ma, CrossingDirection.BELOW) and slow_ma_dn; #// Low-pass filter to avoid generating too many consecutive orders def checkbuy = buy and !buy[1] and !buy[2] and !buy[3] and !buy[4] and !buy[5] and !buy[6]; def checksell = sell and !sell[1] and !sell[2] and !sell[3] and !sell[4] and !sell[5] and !sell[6]; def buy_signal = checkbuy; def sell_signal = checksell; #// Plot color: Green if fast MA higher than slow MA def col = fast_ma >= slow_ma; plot FastMovingAverage = fast_ma;#, title="Fast Moving Average" plot SlowMovingAverage = slow_ma;#, title="Slow Moving Average" FastMovingAverage.SetLineWeight(2); FastMovingAverage.AssignValueColor(if col then Color.GREEN else Color.RED); SlowMovingAverage.AssignValueColor(if col then Color.GREEN else Color.RED); AddChartBubble(buy_signal, low, "Buy", Color.GREEN, no); AddChartBubble(sell_signal, high, "Sell", Color.RED, yes); #-- END of CODE
it should work fine. if you use manual timeframe, make sure the selected time frame to be higher than your chart time frame. it is limitation from TOS.@samer800 I tested it for $AAPL and $ES futures, and the buy or sell signal doesn't show up, could you take a look, and if possible have the last moving average cross only show the buy and sell? thanks a bunch.
@samer800 I tried every combo its not displaying when you get a moment please check.it should work fine. if you use manual timeframe, make sure the selected time frame to be higher than your chart time frame. it is limitation from TOS.
EverGratefulMoneyMagnet
New member
Is it possible to have a vertical pole that goes from the top of the screen to the bottom of the screen at the point of the crossover?
Tried a ChatGPT code earlier, it did not work, something about loop backing.
Anyway, on second try, this is what I downloaded to TOS, it works, its adjustable to fit your trade regime, and will throw out a buy signal that pretty much sticks for a period of time???
# Moving Average Crossover Strategy
# Buy when 50-period MA crosses above 200-period MA
input fastLength = 50; # Length of the fast moving average
input slowLength = 200; # Length of the slow moving average
def fastMA = MovingAverage(AverageType.SIMPLE, close, fastLength);
def slowMA = MovingAverage(AverageType.SIMPLE, close, slowLength);
def buySignal = Crosses(fastMA, slowMA, CrossingDirection.ABOVE);
# Plot the moving averages for visualization
plot FastMAPlot = fastMA;
plot SlowMAPlot = slowMA;
FastMAPlot.SetDefaultColor(GetColor(1));
SlowMAPlot.SetDefaultColor(GetColor(2));
# Plot a buy arrow when the buy signal is true
plot BuySignalPlot = if buySignal then low - 2 else Double.NaN;
BuySignalPlot.SetPaintingStrategy(PaintingStrategy.ARROW_UP);
BuySignalPlot.SetDefaultColor(Color.GREEN);
BuySignalPlot.SetLineWeight(2);
check thisIs it possible to have a vertical pole that goes from the top of the screen to the bottom of the screen at the point of the crossover?
CSS:
#// This source code is subject to the terms of the Mozilla Public License 2.0 at https://mozilla.org/MPL/2.0/
#// © rouxam
#// This simple study generates alerts for buying at MA Crossover in 3commas
#// The alerts are best combined with a DCA bot like 3commas.
#// This works very well on sideways markets with small Take Profits <= 0.6%
#study("MA Crossover Buy Alerts", shorttitle="MA crossover", overlay=true)
# converted by Sam4Cok@Samer800 - request from useThinkScript.com member - 06/2023
# update - added MTF option and Sell Signals by Sam4Cok@Samer800    - 06/2023;
input ShowVerticalLine = yes;
input ma_type         = {SMA, EMA, WMA, HullMA, VWMA, RMA, default TEMA};
input useChartTimeframeForSlowMa = {Default "Yes", "No"};
input manualSlowMaTimeframe = AggregationPeriod.FIFTEEN_MIN;
input slow_ma_period  = 100;    # "Slow MA Period"
input useChartTimeframeForFastMa = {Default "Yes", "No"};
input manualFastMaTimeframe = AggregationPeriod.FIFTEEN_MIN;
input fast_ma_period  = 20;     # "Fast MA Period"

def na = Double.NaN;

def c; def v; def l; def h;
def c1; def v1;

switch (useChartTimeframeForSlowMa) {
case "Yes" :
       c = close;
       v = volume;
       l = low;
       h = high;
case "No" :
       c = close(Period=manualSlowMaTimeframe);
       v = volume(Period=manualSlowMaTimeframe);
       l = low(Period=manualSlowMaTimeframe);
       h = high(Period=manualSlowMaTimeframe);
}
switch (useChartTimeframeForFastMa) {
case "Yes" :
       c1 = close;
       v1 = volume;
case "No" :
       c1 = close(Period=manualFastMaTimeframe);
       v1 = volume(Period=manualFastMaTimeframe);
}

#get_ma(src, ma_type, len) =>
script get_ma {
    input src = close;
    input ma_type = "TEMA";
    input len = 100;
    input v = Volume;
    def hullma = HullMovingAvg(src, len);
    def vwma = Average(src * v, len) / Average(v, len);
    def ema1 = ExpAverage(src, len);
    def ema2 = ExpAverage(ema1, len);
    def ema3 = ExpAverage(ema2, len);
    def tema = 3 * (ema1 - ema2) + ema3;
    def ma = if ma_type == "SMA" then Average(src, len) else
        if ma_type == "EMA" then ExpAverage(src, len)   else
            if ma_type == "WMA" then WMA(src, len) else
                if ma_type == "HullMA" then hullma else
                    if ma_type == "VWMA" then vwma else
                        if ma_type == "RMA" then WildersAverage(src, len) else tema;
    plot out = ma;
}

#// Calculate Fast and Slow Moving averages
def fast_ma = get_ma(c1, ma_type, fast_ma_period, v1);
def slow_ma = get_ma(c, ma_type, slow_ma_period, v);
def slow_ma_up = slow_ma > slow_ma[1];
def slow_ma_dn = slow_ma < slow_ma[1];
#// Buy signal: MA Crossover, with slow MA trending upwards
#def buy = crosses(fast_ma, slow_ma, CrossingDirection.ABOVE) and slow_ma_up;
def buy  = (fast_ma > slow_ma) and (fast_ma[1] <= slow_ma[1]) and slow_ma_up;
def sell = (fast_ma < slow_ma) and (fast_ma[1] >= slow_ma[1]) and slow_ma_dn;
#// Low-pass filter to avoid generating too many consecutive orders
def checkbuy = buy and !buy[1] and !buy[2] and !buy[3] and !buy[4] and !buy[5] and !buy[6];
def checksell = sell and !sell[1] and !sell[2] and !sell[3] and !sell[4] and !sell[5] and !sell[6];
def buy_signal = checkbuy;
def sell_signal = checksell;

#// Plot color: Green if fast MA higher than slow MA
def col = fast_ma >= slow_ma;
plot FastMovingAverage = fast_ma;#, title="Fast Moving Average"
plot SlowMovingAverage = slow_ma;#, title="Slow Moving Average"

FastMovingAverage.SetLineWeight(2);
FastMovingAverage.AssignValueColor(if col then Color.GREEN else Color.RED);
SlowMovingAverage.AssignValueColor(if col then Color.GREEN else Color.RED);

AddChartBubble(buy_signal, l, "Buy",  Color.GREEN, no);
AddChartBubble(sell_signal, h, "Sell",  Color.RED, yes);

AddVerticalLine(ShowVerticalLine and buy_signal, "Buy", Color.GREEN, Curve.SHORT_DASH);
AddVerticalLine(ShowVerticalLine and sell_signal, "Sell", Color.RED, Curve.SHORT_DASH);

#-- END of CODEGood Afternoon @BenTen, I'm very grateful for this indicator, I would like to know if you can add the option to turn on/off the clouds and the option to lower the contrast of the clouds on the settings. Thank you again.This is just a simple indicator for moving average crossover but added scanner, cloud, and alerts for additional visual effect and enhancement.
For example, if 5/10 EMA crossover is your strategy, then this indicator plot an up arrow on the golden cross and down arrow on the death cross. You can also use the scanner to scan for stocks with EMA crossover and the built-in alerts to let you know as it happens.
View attachment 4629
thinkScript Code
Rich (BB code):# Moving Average Crossover With Arrows, Alerts, Crossing Count and Bubble at Cross # Mobius # Chat Room Request 01.25.2017 # Modified a bit by BenTen input price = close; input fastLength = 8; input slowLength = 21; input averageType = AverageType.EXPONENTIAL; plot FastMA = MovingAverage(averageType, price, fastLength); plot SlowMA = MovingAverage(averageType, price, slowLength); FastMA.SetDefaultColor(GetColor(1)); SlowMA.SetDefaultColor(GetColor(2)); plot ArrowUp = if FastMA crosses above SlowMA then low else double.nan; ArrowUP.SetPaintingStrategy(PaintingStrategy.Arrow_UP); ArrowUP.SetLineWeight(3); ArrowUP.SetDefaultColor(Color.Green); plot ArrowDN = if FastMA crosses below SlowMA then high else double.nan; ArrowDN.SetPaintingStrategy(PaintingStrategy.Arrow_DOWN); ArrowDN.SetLineWeight(3); ArrowDN.SetDefaultColor(Color.Red); Alert(ArrowUp, " ", Alert.Bar, Sound.Chimes); Alert(ArrowDN, " ", Alert.Bar, Sound.Bell); AddCloud(FastMA, SlowMA, Color.GREEN, Color.RED); # End Code
Shareable Link
https://tos.mx/2ZED6i
The changes were added to post#1.Good Afternoon @BenTen, I'm very grateful for this indicator, I would like to know if you can add the option to turn on/off the clouds and the option to lower the contrast of the clouds on the settings. Thank you again.
https://usethinkscript.com/threads/moving-average-crossovers-for-thinkorswim.229/#post-1352
You need to re-copy and paste it into your study tab
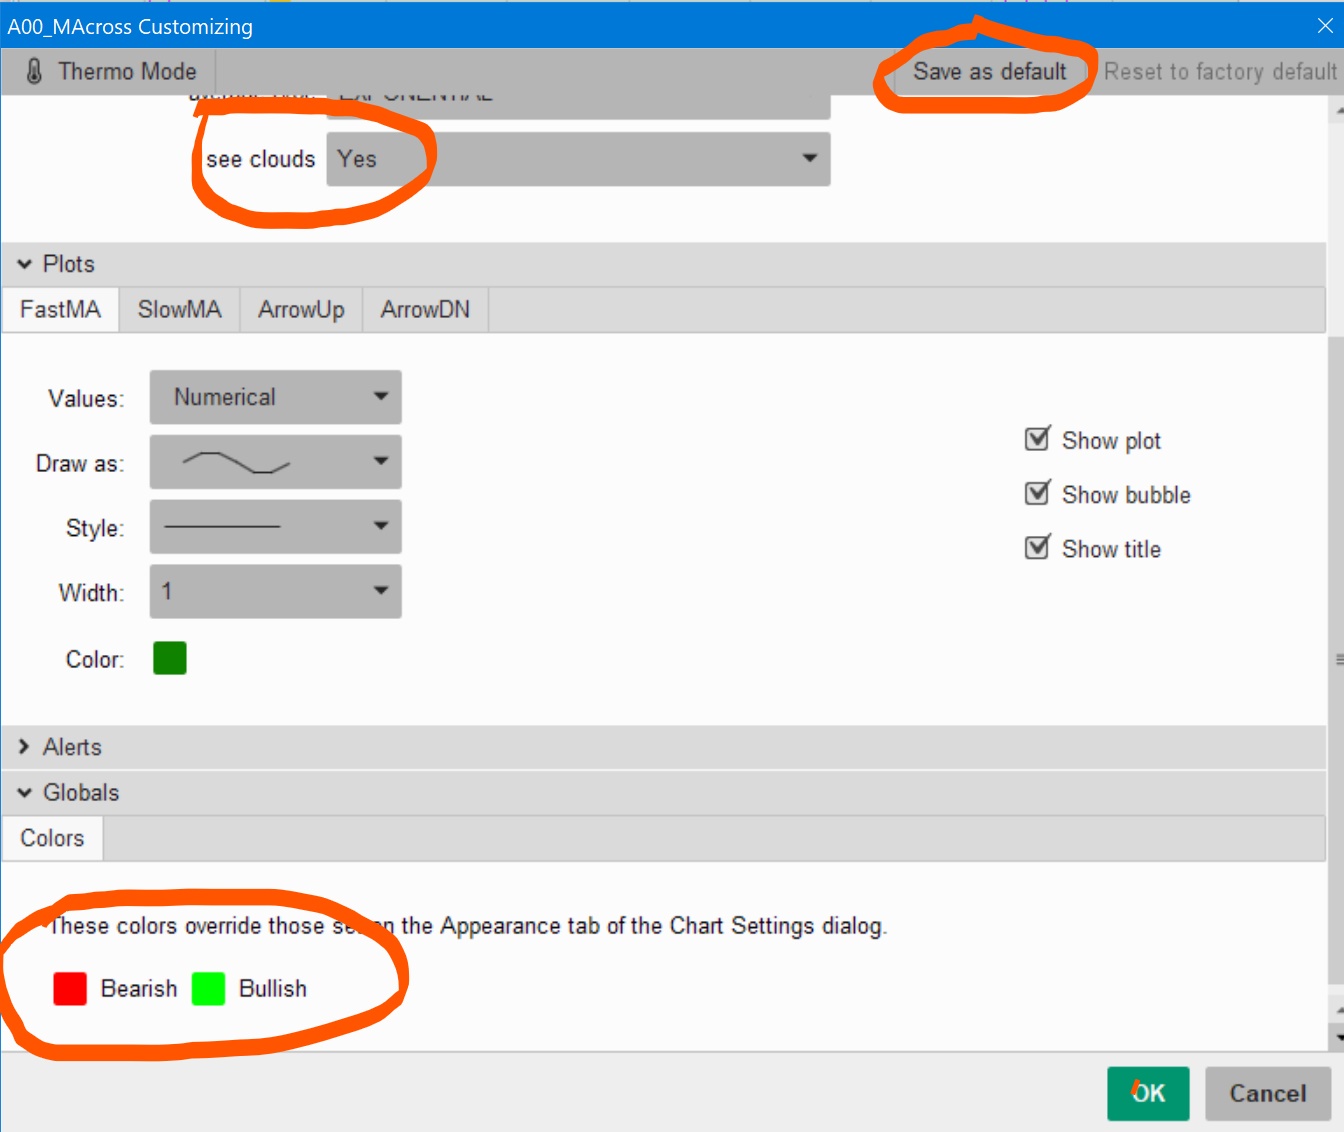
In chart settings
To turn on/off the clouds, click on see clouds
To change cloud coloring:
1. click on Globals
2. click on the color, you want to change
When done, go to the top of settings and click on Save as default to preserve your preferences for use on future charts.
Last edited:
ty so much .How to ad a parameter as follows ??This is just a simple indicator for moving average crossover but added scanner, cloud, and alerts for additional visual effect and enhancement.
For example, if 5/10 EMA crossover is your strategy, then this indicator plot an up arrow on the golden cross and down arrow on the death cross. You can also use the scanner to scan for stocks with EMA crossover and the built-in alerts to let you know as it happens.
View attachment 4629
thinkScript Code
Rich (BB code):# Moving Average Crossover With Arrows, Alerts, Crossing Count and Bubble at Cross # Mobius # Chat Room Request 01.25.2017 # Modified a bit by BenTen input price = close; input fastLength = 8; input slowLength = 21; input averageType = AverageType.EXPONENTIAL; plot FastMA = MovingAverage(averageType, price, fastLength); plot SlowMA = MovingAverage(averageType, price, slowLength); FastMA.SetDefaultColor(GetColor(1)); SlowMA.SetDefaultColor(GetColor(2)); plot ArrowUp = if FastMA crosses above SlowMA then low else double.nan; ArrowUP.SetPaintingStrategy(PaintingStrategy.Arrow_UP); ArrowUP.SetLineWeight(3); ArrowUP.SetDefaultColor(Color.Green); plot ArrowDN = if FastMA crosses below SlowMA then high else double.nan; ArrowDN.SetPaintingStrategy(PaintingStrategy.Arrow_DOWN); ArrowDN.SetLineWeight(3); ArrowDN.SetDefaultColor(Color.Red); Alert(ArrowUp, " ", Alert.Bar, Sound.Chimes); Alert(ArrowDN, " ", Alert.Bar, Sound.Bell); DefineGlobalColor("Bullish", color.green); DefineGlobalColor("Bearish", color.red); input seeClouds = yes ; AddCloud(if(seeClouds,FastMA,double.NaN), SlowMA, GlobalColor("Bullish"), GlobalColor("Bearish")); # End Code
Shareable Link
https://tos.mx/2ZED6i
??thanks in advanceif FastMA crosses 1 point higher above SlowMA
Last edited:
the best I guess to use ATR band. Add below code and you can use the signals if FastMa cross above/Below the ATR band.ty so much .How to ad a parameter as follows ??
??thanks in advance
CSS:
input atrLength = 200;
input atrMulti = 1.0;
def streach = ATR(Length = atrLength) * atrMulti;
AddCloud(slow_ma + streach, slow_ma - streach, Color.DARK_GRAY, Color.DARK_GRAY, yes);bulusufinances
New member
This is one of my favorite indicators on TV built by EquityCraze there.
https://www.tradingview.com/script/tzQaOzmV-Stage-Analysis/
https://www.tradingview.com/script/tzQaOzmV-Stage-Analysis/
Last edited by a moderator:
this is a simple moving averages crossing.This is one of my favorite indicators on TV built by EquityCraze there.
https://www.tradingview.com/script/tzQaOzmV-Stage-Analysis/
@samer800 - I'd sincerely appreciate any help with the conversion of this indicator. Thanks in advance.
I'd love to be able to stick to a single TOS platform vs. switching for validations.
Code:## https://www.tradingview.com/v/tzQaOzmV/ // This source code is subject to the terms of the Mozilla Public License 2.0 at https://mozilla.org/MPL/2.0/ // © EquityCraze //@version=5 indicator(title='Stage Analysis', overlay=true) period = timeframe.period valid_periods = period == 'D' or period == 'W' // function to convert daily period to weekly period get_sma_period(sma_input) => if period == 'D' int(sma_input) else int(sma_input / 5) dma50_days = get_sma_period(50) dma150_days = get_sma_period(150) dma200_days = get_sma_period(200) dma50_days_visible = input(title='dma50_days', defval=false) dma150_days_visible = input(title='dma150_days', defval=false) dma200_days_visible = input(title='dma200_days', defval=false) show_50_pointer = input(title='50X150', defval=true) show_150_pointer = input(title='150X200', defval=true) show_200_pointer = input(title='50X200', defval=true) DMA50 = ta.sma(close, dma50_days) DMA150 = ta.sma(close, dma150_days) DMA200 = ta.sma(close, dma200_days) if show_50_pointer and show_150_pointer and ta.crossunder(DMA50, DMA150) and valid_periods stage3_starting = label.new(bar_index, na, yloc=yloc.price, color=color.yellow, style=label.style_label_down, size=size.tiny) label.set_y(stage3_starting, DMA50) label.set_tooltip(stage3_starting, str.tostring(dma150_days) + ' x ' + str.tostring(dma50_days)) if show_50_pointer and show_150_pointer and ta.crossover(DMA50, DMA150) and valid_periods stage2_starting = label.new(bar_index, na, yloc=yloc.price, color=color.green, style=label.style_label_up, size=size.tiny) label.set_y(stage2_starting, DMA50) label.set_tooltip(stage2_starting, str.tostring(dma50_days) + ' x ' + str.tostring(dma150_days)) if show_50_pointer and show_200_pointer and ta.crossunder(DMA50, DMA200) and valid_periods stage4 = label.new(bar_index, na, yloc=yloc.price, color=color.red, style=label.style_label_down, size=size.tiny) label.set_y(stage4, DMA50) label.set_tooltip(stage4, str.tostring(dma200_days) + ' x ' + str.tostring(dma50_days)) if show_50_pointer and show_200_pointer and ta.crossover(DMA50, DMA200) and valid_periods stage2_accumulation = label.new(bar_index, na, yloc=yloc.price, color=color.green, style=label.style_label_up, size=size.tiny) label.set_y(stage2_accumulation, DMA50) label.set_tooltip(stage2_accumulation, str.tostring(dma50_days) + ' x ' + str.tostring(dma200_days)) if show_150_pointer and show_200_pointer and ta.crossunder(DMA150, DMA200) and valid_periods stage3_starting = label.new(bar_index, na, yloc=yloc.price, color=color.yellow, style=label.style_label_down, size=size.tiny) label.set_y(stage3_starting, DMA150) label.set_tooltip(stage3_starting, str.tostring(dma200_days) + ' x ' + str.tostring(dma150_days)) if show_150_pointer and show_200_pointer and ta.crossover(DMA150, DMA200) and valid_periods stage2_confirmed = label.new(bar_index, na, yloc=yloc.price, color=color.yellow, style=label.style_label_up, size=size.tiny) label.set_y(stage2_confirmed, DMA150) label.set_tooltip(stage2_confirmed, str.tostring(dma150_days) + ' x ' + str.tostring(dma200_days)) plot(dma50_days_visible and valid_periods ? DMA50 : na, color=color.new(color.green, 10), linewidth=1) plot(dma150_days_visible and valid_periods ? DMA150 : na, color=color.new(color.yellow, 20), linewidth=2) plot(dma200_days_visible and valid_periods ? DMA200 : na, color=color.new(color.red, 30), linewidth=3)

same script below.
CSS:
# 3 MovingAverage Crosses
# Request from useThinkScript.com memeber
# Sam4Cok@Samer800     - 10/2023
input MovAvgType = AverageType.SIMPLE;
input showMovAvg1 = yes;
input source1     = close;
input MovAvgLength1 = 50;
input showSignal1 = yes;
input showMovAvg2 = yes;
input source2     = close;
input MovAvgLength2 = 150;
input showSignal2 = yes;
input showMovAvg3 = yes;
input source3     = close;
input MovAvgLength3 = 200;
input showSignal3 = yes;

def na = Double.NaN;

def DMAfast = MovingAverage(MovAvgType, source1, MovAvgLength1);
def DMAmid  = MovingAverage(MovAvgType, source2, MovAvgLength2);
def DMAslow = MovingAverage(MovAvgType, source3, MovAvgLength3);

def crossUnder1 = showSignal1 and Crosses(DMAfast, DMAmid, CrossingDirection.BELOW);
def crossAbove1 = showSignal1 and Crosses(DMAfast, DMAmid, CrossingDirection.ABOVE);
def crossUnder2 = showSignal2 and Crosses(DMAfast, DMAslow, CrossingDirection.BELOW);
def crossAbove2 = showSignal2 and Crosses(DMAfast, DMAslow, CrossingDirection.ABOVE);
def crossUnder3 = showSignal3 and Crosses(DMAmid, DMAslow, CrossingDirection.BELOW);
def crossAbove3 = showSignal3 and Crosses(DMAmid, DMAslow, CrossingDirection.ABOVE);

def signal = if crossUnder1 then -1 else
             if crossUnder2 then -2 else
             if crossUnder3 then -3 else
             if crossAbove1 then 1 else
             if crossAbove2 then 2 else
             if crossAbove3 then 3 else na;

AddChartBubble(signal==-1, high,MovAvgLength1 + "DMA", Color.YELLOW);
AddChartBubble(signal== 1, low, MovAvgLength1 + "DMA", Color.GREEN, no);

AddChartBubble(signal==-2, high,MovAvgLength2 + "DMA", Color.RED);
AddChartBubble(signal== 2, low, MovAvgLength2 + "DMA", Color.GREEN, no);

AddChartBubble(signal==-3, high,MovAvgLength3 + "DMA", Color.YELLOW);
AddChartBubble(signal== 3, low, MovAvgLength3 + "DMA", Color.YELLOW, no);

plot MovFast = if showMovAvg1 then DMAfast else na;
plot MovMid  = if showMovAvg2 then DMAmid  else na;
plot MovSlow = if showMovAvg3 then DMAslow else na;

MovFast.SetDefaultColor(Color.GREEN);
MovMid.SetDefaultColor(Color.YELLOW);
MovSlow.SetDefaultColor(Color.RED);

#-- END OF CODEbulusufinances
New member
Is the script in the first post the latest one? I need alerts on the chart for any 2 MAs crossovers.. Please guide me.. If there are changes to the first post script, please send me the post# of the script where there is a latest script for the MAs cross overs with alerts, bubbles etc..
Since this is a moving average crossover indicator place, I would like to ask to add this indicator construct below to constructions already presented in this thread, with partial extract from :
https://usethinkscript.com/threads/center-of-gravity-cog-indicator-for-thinkorswim.138/
maybe as a function being referenced. You can use the code below as a stand alone indicator to test.
I have found this crossover very good to suggest reversals.
# source from https://usethinkscript.com/threads/center-of-gravity-cog-indicator-for-thinkorswim.138/
input price = close;
input length1 = 5;
def displacement1 = (-length1 / 2) + 1;
def dPrice1 = price[displacement1];
def tmp1 = if !IsNaN(dPrice1) then Average(dPrice1, AbsValue(-length1)) else tmp1[1] + (tmp1[1] - tmp1[2]);
def tmpx1 = if !IsNaN(price) then tmp1 else Double.NaN;
plot Data1 = tmpx1;
Data1.SetDefaultColor(color.CYAN );
Data1.SetStyle(Curve.FIRM);
#this is secondary moving average based on the previous one
def price2 = Data1;
input length2 =2;
def displacement2 = (-length2 / 2) + 1;
def dPrice2 = price2[displacement2];
def tmp2 = if !IsNaN(dPrice2) then Average(dPrice2, AbsValue(-length2)) else tmp2[1] + (tmp2[1] - tmp2[2]);
def tmpx2 = if !IsNaN(price2) then tmp2 else Double.NaN;
plot Data2 = tmpx2;
Data2.SetDefaultColor(color.yellow );
Data2.SetStyle(Curve.FIRM);
Is the script in the first post the latest one? I need alerts on the chart for any 2 MAs crossovers.. Please guide me.. If there are changes to the first post script, please send me the post# of the script where there is a latest script for the MAs cross overs with alerts, bubbles etc..
The 1st line in the code in the 1st post: "# Moving Average Crossover With Arrows, Alerts, Crossing Count and Bubble at Cross"
Join useThinkScript to post your question to a community of 21,000+ developers and traders.
| Thread starter | Similar threads | Forum | Replies | Date |
|---|---|---|---|---|
| A | Farey Sequence Weighted Moving Average For ThinkOrSwim | Indicators | 16 | |
| L | A Volume Pressure Moving Average For ThinkOrSwim | Indicators | 14 | |
|
|
Mega Moving Average For ThinkOrSwim | Indicators | 26 | |
| S | Moving Average Golden Cross - Death Cross For ThinkOrSwim | Indicators | 16 | |
| D | Repaints MTF Moving Average Slope Histogram For ThinkOrSwim | Indicators | 20 |
Similar threads
-
Farey Sequence Weighted Moving Average For ThinkOrSwim
- Started by AlphaOptions
- Replies: 16
-
-

-
Moving Average Golden Cross - Death Cross For ThinkOrSwim
- Started by starone777
- Replies: 16
-
Repaints MTF Moving Average Slope Histogram For ThinkOrSwim
- Started by DaysOff
- Replies: 20
Not the exact question you're looking for?
Start a new thread and receive assistance from our community.
87k+
Posts
1840
Online
Similar threads
-
Farey Sequence Weighted Moving Average For ThinkOrSwim
- Started by AlphaOptions
- Replies: 16
-
-
-
Moving Average Golden Cross - Death Cross For ThinkOrSwim
- Started by starone777
- Replies: 16
-
Repaints MTF Moving Average Slope Histogram For ThinkOrSwim
- Started by DaysOff
- Replies: 20
The Market Trading Game Changer
Join 2,500+ subscribers inside the useThinkScript VIP Membership Club
- Exclusive indicators
- Proven strategies & setups
- Private Discord community
- ‘Buy The Dip’ signal alerts
- Exclusive members-only content
- Add-ons and resources
- 1 full year of unlimited support
Frequently Asked Questions
What is useThinkScript?
useThinkScript is the #1 community of stock market investors using indicators and other tools to power their trading strategies. Traders of all skill levels use our forums to learn about scripting and indicators, help each other, and discover new ways to gain an edge in the markets.
How do I get started?
We get it. Our forum can be intimidating, if not overwhelming. With thousands of topics, tens of thousands of posts, our community has created an incredibly deep knowledge base for stock traders. No one can ever exhaust every resource provided on our site.
If you are new, or just looking for guidance, here are some helpful links to get you started.
- The most viewed thread:
https://usethinkscript.com/threads/repainting-trend-reversal-for-thinkorswim.183/ - Our most popular indicator:
https://usethinkscript.com/threads/buy-the-dip-indicator-for-thinkorswim.3553/ - Answers to frequently asked questions:
https://usethinkscript.com/threads/answers-to-commonly-asked-questions.6006/
What are the benefits of VIP Membership?
VIP members get exclusive access to these proven and tested premium indicators: Buy the Dip, Advanced Market Moves 2.0, Take Profit, and Volatility Trading Range. In addition, VIP members get access to over 50 VIP-only custom indicators, add-ons, and strategies, private VIP-only forums, private Discord channel to discuss trades and strategies in real-time, customer support, trade alerts, and much more. Learn all about VIP membership here.
How can I access the premium indicators?
To access the premium indicators, which are plug and play ready, sign up for VIP membership here.