Micro Double Top/Micro Double Bottom

bon

New member
Can anyone post an indicator that draws a small line/dot when two consecutive bars close with a high or a low at the same price? For example, if two consecutive bars both have a high at 4430.50 can a small line/dot be drawn above those bars? Or if two consecutive bars both have a low of 4429.50 can a small line/dot be drawn beneath those bars?

It would be nice if this indicator had a feature where if it's off by a tick or two the user could select whether it still qualifies. For example, with the "offset" feature turned to 1, if one bar closes with a high at 4430.50 and the next closes with a high at 4430.25, that could still be shown as a double top. No worries if that's too complicated though.

I am trading futures on /MES and this what Al Brooks refers to as a "Micro Double Top" and "Micro Double Bottom."
 
Solution
Can anyone post an indicator that draws a small line/dot when two consecutive bars close with a high or a low at the same price? For example, if two consecutive bars both have a high at 4430.50 can a small line/dot be drawn above those bars? Or if two consecutive bars both have a low of 4429.50 can a small line/dot be drawn beneath those bars?

It would be nice if this indicator had a feature where if it's off by a tick or two the user could select whether it still qualifies. For example, with the "offset" feature turned to 1, if one bar closes with a high at 4430.50 and the next closes with a high at 4430.25, that could still be shown as a double top. No worries if that's too complicated though.

I am trading futures on /MES and...
Here you go.

You're the only person on this forum I've seen reference Al, so that drew my attention. I started with his books years ago and it's invaluable information. Best of luck.

Just a word of caution, this does not quite look correct for a couple reasons.

1. Al does not consider anything but a perfect match a true MDT/MDB. He considers a 1 tick higher/lower top/bottom a 1 tick failure, so it's best to chart only exact MDT/MDBs. If you try to match anything within 1 or 2 ticks you're going to get a lot of bars showing MDTs/MDBs that aren't.

2. Because this study has to look at future bars, it may not draw a line on the first bar that's an MDT/MDB.

It's a start, but you may want to consider tweaking the conditions to get exactly what you want.


Ruby:
#DECLARATIONS
declare upper;
declare once_per_bar;


#USER INPUTS
input tickDifferenceAllowed = 1;


#DEFINITIONS
def isMDT =
    high == high[1]
    or high == high[1] - (tickDifferenceAllowed * TickSize())
    or high == high[-1]
    or high == high[-1] + (tickDifferenceAllowed * TickSize());


def isMDB =
    low == low[1]
    or low == low[1] - (tickDifferenceAllowed * TickSize())
    or low == low[-1]
    or low == low[-1] + (tickDifferenceAllowed * TickSize());


#PLOTS
plot mdt = if isMDT then Min(high, high[1]) else Double.NaN;
plot mdb = if isMDB then Max(low, low[1]) else Double.NaN;;


#FORMATTING
mdt.setdefaultcolor(Color.RED);
mdt.SetPaintingStrategy(PaintingStrategy.HORIZONTAL);
mdt.hidetitle();
mdt.hidebubble();

mdb.setdefaultcolor(Color.GREEN);
mdb.SetPaintingStrategy(PaintingStrategy.DASHES);
mdb.hidetitle();
mdb.hidebubble();
 
Last edited:
  • Like
Reactions: bon

Join useThinkScript to post your question to a community of 21,000+ developers and traders.

Can anyone post an indicator that draws a small line/dot when two consecutive bars close with a high or a low at the same price? For example, if two consecutive bars both have a high at 4430.50 can a small line/dot be drawn above those bars? Or if two consecutive bars both have a low of 4429.50 can a small line/dot be drawn beneath those bars?

It would be nice if this indicator had a feature where if it's off by a tick or two the user could select whether it still qualifies. For example, with the "offset" feature turned to 1, if one bar closes with a high at 4430.50 and the next closes with a high at 4430.25, that could still be shown as a double top. No worries if that's too complicated though.

I am trading futures on /MES and this what Al Brooks refers to as a "Micro Double Top" and "Micro Double Bottom."

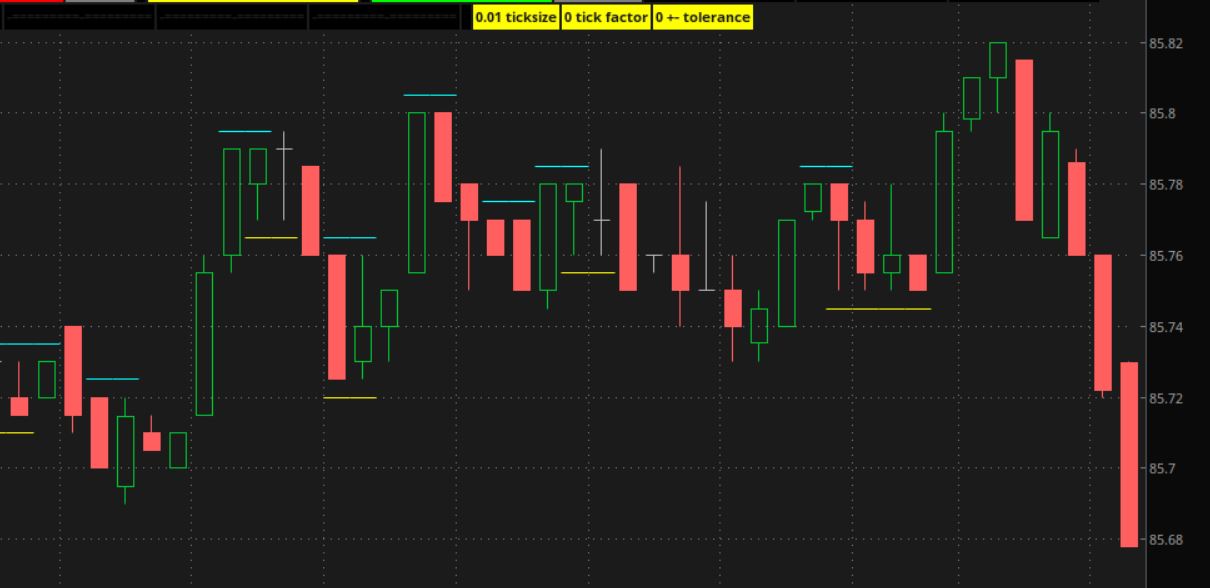
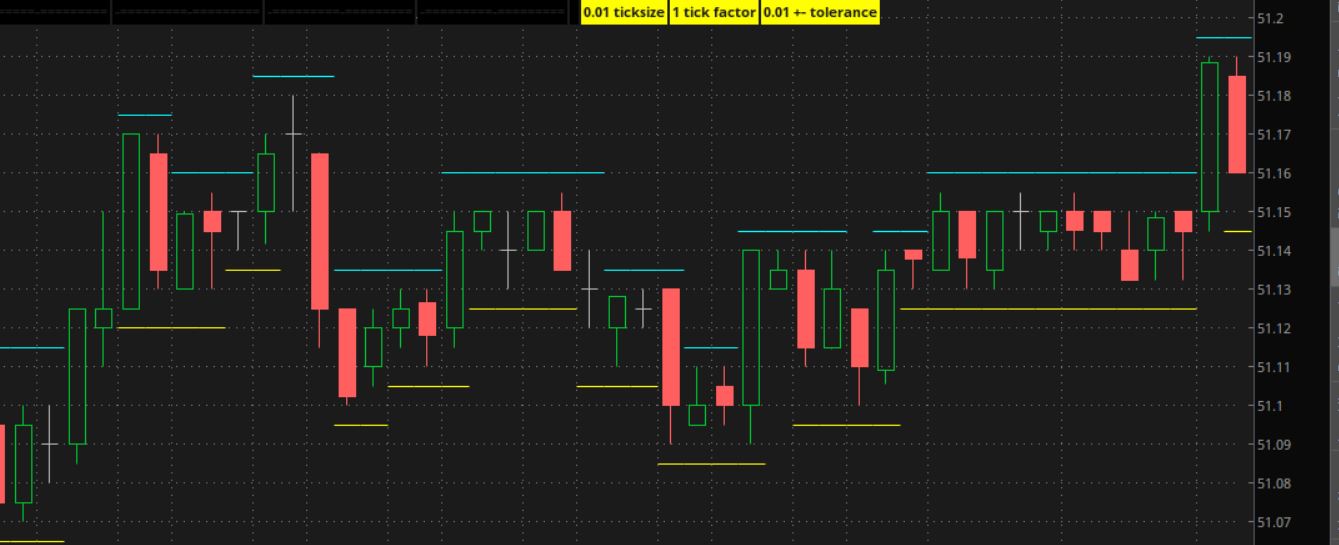
find 2+ consecutive bars with the same high price or same low price.
once a line starts, a new grouping can't happen until after the current one.

can choose a tolerance factor, that is multiplied by the ticksize.
...if 0 is chosen, then the prices have to be the same.

i think lines are easier to see if they don't touch the candles so,
...horizontal high lines are drawn slightly above the candles.
...horizontal low lines are drawn slightly below the candles.

labels display the tolerance and ticksize.

i started with armybenders code, but ended up redoing it. his code would draw diagonal lines because of the plot formula.


Code:
# same_hiorlo_01f

#Micro Double Top/Micro Double Bottom
# find bars of same highs or same lows

def na = Double.NaN;
def bn = barnumber();

input tick_factor = 1;
def ts = TickSize();
def t = (tick_factor * ts);

addlabel(1, " ", color.black);
addlabel(1, ts + " ticksize", color.yellow);
addlabel(1, tick_factor + " tick factor", color.yellow);
addlabel(1, t + " +- tolerance", color.yellow);

def n = 100;
def big = 99999;

#-------------------
# top lines

def topcnt2 = fold i1 = 1 to n
 with p1 = 0
 while (high <= (getvalue(high, -i1) + (tick_factor * TickSize() )) and high >= (getvalue(high, -i1) - (tick_factor * TickSize() )))
do p1 + 1;

def topcnt = if topcnt2 > 0 then topcnt2 + 1 else 0;

#  down counter
def topcntdwn = if bn == 1 then 0
 else if topcntdwn[1] <= 1 then topcnt
 else if topcntdwn[1] > 0 then topcntdwn[1] - 1
 else 0;

# find max of group of bars
def toplvl = if topcntdwn[0] > topcntdwn[1] then
   (fold i2 = 0 to topcnt
    with p2
    do max(p2, getvalue(high, -i2)))
 else if  topcntdwn[1] >= 2 then toplvl[1]
   else 0;

#---------------------------------
# bottom lines

def botcnt2 = fold i3 = 1 to n
 with p3 = 0
 while (low <= (getvalue(low, -i3) + (tick_factor * TickSize() )) and low >= (getvalue(low, -i3) - (tick_factor * TickSize() )))
do p3 + 1;

def botcnt = if botcnt2 > 0 then botcnt2 + 1 else 0;

#  down counter
def botcntdwn = if bn == 1 then 0
 else if botcntdwn[1] <= 1 then botcnt
 else if botcntdwn[1] > 0 then botcntdwn[1] - 1
 else 0;

# find min of group of bars
def botlvl = if botcntdwn[0] > botcntdwn[1] then
   (fold i4 = 0 to botcnt
    with p4 = big
    do min(p4, getvalue(low, -i4)))
 else if  botcntdwn[1] >= 2 then botlvl[1]
   else 0;

#-----------------------

def y = (0.5 * ts);

plot ztop = if toplvl > 0 then toplvl + y else na;
ztop.SetPaintingStrategy(PaintingStrategy.HORIZONTAL);
ztop.SetDefaultColor(Color.cyan);
ztop.setlineweight(1);

plot zbot = if botlvl > 0 then botlvl - y else na;
zbot.SetPaintingStrategy(PaintingStrategy.HORIZONTAL);
zbot.SetDefaultColor(Color.yellow);
zbot.hidebubble();

#--------------------

input test1_topnumbers = no;
addchartbubble(test1_topnumbers, low*0.999,
topcnt + " cnt\n" +
topcntdwn + " cntd\n" +
toplvl + " max\n"
, color.yellow, no);

input test2_botnumbers = no;
addchartbubble(test2_botnumbers, low*0.999,
botcnt + " cnt\n" +
botcntdwn + " cntd\n" +
botlvl + " min\n"
, color.yellow, no);

#

tolerance = 0
T6Ke53H.jpg


tolerance = 1
lKbUdXo.jpg
 
Last edited:
Solution
Thank you! Exactly what I was looking for... Thank you, Armybender, too.
find 2+ consecutive bars with the same high price or same low price.

can choose a tolerance factor, that is multiplied by the ticksize.
...if 0 is chosen, then the prices have to be the same.

i think lines are easier to see if they don't touch the candles so,
...horizontal high lines are drawn slightly above the candles.
...horizontal low lines are drawn slightly below the candles.

labels display the tolerance and ticksize.

i started with armybenders code, but ended up redoing it. his code would draw diagonal lines because of the plot formula.


Code:
# same_hiorlo_01f

#Micro Double Top/Micro Double Bottom
# find bars of same highs or same lows

def na = Double.NaN;
def bn = barnumber();

input tick_factor = 1;
def ts = TickSize();
def t = (tick_factor * ts);

addlabel(1, " ", color.black);
addlabel(1, ts + " ticksize", color.yellow);
addlabel(1, tick_factor + " tick factor", color.yellow);
addlabel(1, t + " +- tolerance", color.yellow);

def n = 100;
def big = 99999;

#-------------------
# top lines

def topcnt2 = fold i1 = 1 to n
 with p1 = 0
 while (high <= (getvalue(high, -i1) + (tick_factor * TickSize() )) and high >= (getvalue(high, -i1) - (tick_factor * TickSize() )))
do p1 + 1;

def topcnt = if topcnt2 > 0 then topcnt2 + 1 else 0;

#  down counter
def topcntdwn = if bn == 1 then 0
 else if topcntdwn[1] <= 1 then topcnt
 else if topcntdwn[1] > 0 then topcntdwn[1] - 1
 else 0;

# find max of group of bars
def toplvl = if topcntdwn[0] > topcntdwn[1] then
   (fold i2 = 0 to topcnt
    with p2
    do max(p2, getvalue(high, -i2)))
 else if  topcntdwn[1] >= 2 then toplvl[1]
   else 0;

#---------------------------------
# bottom lines

def botcnt2 = fold i3 = 1 to n
 with p3 = 0
 while (low <= (getvalue(low, -i3) + (tick_factor * TickSize() )) and low >= (getvalue(low, -i3) - (tick_factor * TickSize() )))
do p3 + 1;

def botcnt = if botcnt2 > 0 then botcnt2 + 1 else 0;

#  down counter
def botcntdwn = if bn == 1 then 0
 else if botcntdwn[1] <= 1 then botcnt
 else if botcntdwn[1] > 0 then botcntdwn[1] - 1
 else 0;

# find min of group of bars
def botlvl = if botcntdwn[0] > botcntdwn[1] then
   (fold i4 = 0 to botcnt
    with p4 = big
    do min(p4, getvalue(low, -i4)))
 else if  botcntdwn[1] >= 2 then botlvl[1]
   else 0;

#-----------------------

def y = (0.5 * ts);

plot ztop = if toplvl > 0 then toplvl + y else na;
ztop.SetPaintingStrategy(PaintingStrategy.HORIZONTAL);
ztop.SetDefaultColor(Color.cyan);
ztop.setlineweight(1);

plot zbot = if botlvl > 0 then botlvl - y else na;
zbot.SetPaintingStrategy(PaintingStrategy.HORIZONTAL);
zbot.SetDefaultColor(Color.yellow);
zbot.hidebubble();

#--------------------

input test1_topnumbers = no;
addchartbubble(test1_topnumbers, low*0.999,
topcnt + " cnt\n" +
topcntdwn + " cntd\n" +
toplvl + " max\n"
, color.yellow, no);

input test2_botnumbers = no;
addchartbubble(test2_botnumbers, low*0.999,
botcnt + " cnt\n" +
botcntdwn + " cntd\n" +
botlvl + " min\n"
, color.yellow, no);

#

tolerance = 0
T6Ke53H.jpg


tolerance = 1
lKbUdXo.jpg
 

Similar threads

Not the exact question you're looking for?

Start a new thread and receive assistance from our community.

87k+ Posts
315 Online
Create Post

Similar threads

Similar threads

The Market Trading Game Changer

Join 2,500+ subscribers inside the useThinkScript VIP Membership Club
  • Exclusive indicators
  • Proven strategies & setups
  • Private Discord community
  • ‘Buy The Dip’ signal alerts
  • Exclusive members-only content
  • Add-ons and resources
  • 1 full year of unlimited support

Frequently Asked Questions

What is useThinkScript?

useThinkScript is the #1 community of stock market investors using indicators and other tools to power their trading strategies. Traders of all skill levels use our forums to learn about scripting and indicators, help each other, and discover new ways to gain an edge in the markets.

How do I get started?

We get it. Our forum can be intimidating, if not overwhelming. With thousands of topics, tens of thousands of posts, our community has created an incredibly deep knowledge base for stock traders. No one can ever exhaust every resource provided on our site.

If you are new, or just looking for guidance, here are some helpful links to get you started.

What are the benefits of VIP Membership?
VIP members get exclusive access to these proven and tested premium indicators: Buy the Dip, Advanced Market Moves 2.0, Take Profit, and Volatility Trading Range. In addition, VIP members get access to over 50 VIP-only custom indicators, add-ons, and strategies, private VIP-only forums, private Discord channel to discuss trades and strategies in real-time, customer support, trade alerts, and much more. Learn all about VIP membership here.
How can I access the premium indicators?
To access the premium indicators, which are plug and play ready, sign up for VIP membership here.
Back
Top