
Here are several ThinkorSwim indicators that show value areas based on Market Profile, ShadowTrader's Value Areas study, a scanner to look for Price in value area and volume spike.
The market profile chart is a tool displaying price levels traded during a specific time, to see where the market spends time and forms value.
It reveals price distribution, indicating areas of high and low activity.
Use it to identify support, resistance, and potential breakout areas.
Observe price distribution to recognize key levels, and focus on areas where the market lingers.

Shareable Link: https://tos.mx/8RYZ99
The market profile chart is a tool displaying price levels traded during a specific time, to see where the market spends time and forms value.
It reveals price distribution, indicating areas of high and low activity.
Use it to identify support, resistance, and potential breakout areas.
Observe price distribution to recognize key levels, and focus on areas where the market lingers.
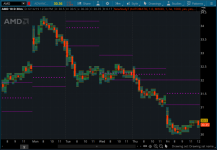
Value Areas from the previous day
Rich (BB code):
# Archive Name: Volume Profile with Expanded Intraday Period Selections plus the Prior Day's Value Areas
# Archive Section: Volume
# Suggested Tos Name: VolumeProfileIntradayPeriods_Unknown
# Archive Date: 5.05.2018
# Archive Notes: found in stanL's treebase but that crashed.  Mobius found this one.

#VolumeProfile with Expanded Intraday Period Selections plus the Prior Day's Value Areas
input pricePerRowHeightMode = {default AUTOMATIC, TICKSIZE, CUSTOM};
input customRowHeight = 1.0;
input timePerProfile = {CHART, MINUTE, MIN2, MIN3, MIN4, MIN5, MIN10, MIN15, MIN20, default MIN30, HOUR, DAY, WEEK, MONTH, "OPT EXP", BAR};
input multiplier = 1;
input onExpansion = no;
input profiles = 1000;
input showPointOfControl = yes;
input showValueArea = yes;
input valueAreaPercent = 70;
input opacity = 20; # 5.05.2018 JQ original was 50

def period;
def yyyymmdd = GetYYYYMMDD();
def seconds = SecondsFromTime(0);
def month = GetYear() * 12 + GetMonth();
def day_number = DaysFromDate(First(yyyymmdd)) + GetDayOfWeek(First(yyyymmdd));
def dom = GetDayOfMonth(yyyymmdd);
def dow = GetDayOfWeek(yyyymmdd - dom + 1);
def expthismonth = (if dow > 5 then 27 else 20) - dow;
def exp_opt = month + (dom > expthismonth);
switch (timePerProfile) {
case CHART:
    period = 0;
case MINUTE:
    period = Floor(seconds / 60 + day_number * 24 * 60);
case MIN2:
    period = Floor(seconds / 120 + day_number * 24);
case MIN3:
    period = Floor(seconds / 180 + day_number * 24);
case MIN4:
    period = Floor(seconds / 240 + day_number * 24);
case MIN5:
    period = Floor(seconds / 300 + day_number * 24);
case MIN10:
    period = Floor(seconds / 600 + day_number * 24);
case MIN15:
    period = Floor(seconds / 900 + day_number * 24);
case MIN20:
    period = Floor(seconds / 1200 + day_number * 24);
case MIN30:
    period = Floor(seconds / 1800 + day_number * 24);
case HOUR:
    period = Floor(seconds / 3600 + day_number * 24);
case DAY:
    period = CountTradingDays(Min(First(yyyymmdd), yyyymmdd), yyyymmdd) - 1;
case WEEK:
    period = Floor(day_number / 7);
case MONTH:
    period = Floor(month - First(month));
case "OPT EXP":
    period = exp_opt - First(exp_opt);
case BAR:
    period = BarNumber() - 1;
}

def count = CompoundValue(1, if period != period[1] then (count[1] + period - period[1]) % multiplier else count[1], 0);
#def volcount = if period != period[1] then  volume  else  volcount[1]+volume;
#addlabel(yes,volcount,color.white);
def cond = count < count[1] + period - period[1];
def height;
switch (pricePerRowHeightMode) {
case AUTOMATIC:
    height = PricePerRow.AUTOMATIC;
case TICKSIZE:
    height = PricePerRow.TICKSIZE;
case CUSTOM:
    height = customRowHeight;
}

profile vol = VolumeProfile("startNewProfile" = cond, "onExpansion" = onExpansion, "numberOfProfiles" = profiles, "pricePerRow" = height, "value area percent" = valueAreaPercent);
def con = CompoundValue(1, onExpansion, no);
def pc = if IsNaN(vol.GetPointOfControl()) and con then pc[1] else vol.GetPointOfControl();
def hVA = if IsNaN(vol.GetHighestValueArea()) and con then hVA[1] else vol.GetHighestValueArea();
def lVA = if IsNaN(vol.GetLowestValueArea()) and con then lVA[1] else vol.GetLowestValueArea();

def hProfile = if IsNaN(vol.GetHighest()) and con then hProfile[1] else vol.GetHighest();
def lProfile = if IsNaN(vol.GetLowest()) and con then lProfile[1] else vol.GetLowest();
def plotsDomain = IsNaN(close) == onExpansion;

plot POC = if plotsDomain then pc else Double.NaN;
plot ProfileHigh = if plotsDomain then hProfile else Double.NaN;
plot ProfileLow = if plotsDomain then lProfile else Double.NaN;
plot VAHigh = if plotsDomain then hVA else Double.NaN;
plot VALow = if plotsDomain then lVA else Double.NaN;

DefineGlobalColor("Profile", GetColor(1));
DefineGlobalColor("Point Of Control", GetColor(5));
DefineGlobalColor("Value Area", GetColor(8));

vol.Show(GlobalColor("Profile"), if showPointOfControl then GlobalColor("Point Of Control") else Color.CURRENT, if showValueArea then GlobalColor("Value Area") else Color.CURRENT, opacity);
POC.SetDefaultColor(GlobalColor("Point Of Control"));
POC.SetPaintingStrategy(PaintingStrategy.HORIZONTAL);
VAHigh.SetPaintingStrategy(PaintingStrategy.HORIZONTAL);
VALow.SetPaintingStrategy(PaintingStrategy.HORIZONTAL);
VAHigh.SetDefaultColor(GlobalColor("Value Area"));
VALow.SetDefaultColor(GlobalColor("Value Area"));
ProfileHigh.SetPaintingStrategy(PaintingStrategy.HORIZONTAL);
ProfileLow.SetPaintingStrategy(PaintingStrategy.HORIZONTAL);
ProfileHigh.SetDefaultColor(GetColor(3));
ProfileLow.SetDefaultColor(GetColor(3));
ProfileHigh.Hide();
ProfileLow.Hide();

#Prior Day Profile - counting formula by functionform
rec count1 = CompoundValue(1, if !(GetDay() != GetDay()[1]) then count1[1] + 1 else 1, 1);
def priorperiod = if IsNaN(count1[1]) then 1 else Max(count1, count1[1]);
profile vol1 = VolumeProfile("startNewProfile" = GetDay() != GetDay()[1], "onExpansion" = no);

def vahprior = vol1.GetHighestValueArea();
def pocprior = vol1.GetPointOfControl();
def valprior = vol1.GetLowestValueArea();

plot vahprev = GetValue(vahprior, priorperiod);
vahprev.SetDefaultColor(Color.MAGENTA);
vahprev.SetPaintingStrategy(paintingStrategy = PaintingStrategy.HORIZONTAL);
vahprev.SetLineWeight(1);
vahprev.HideBubble();

plot pocprev = GetValue(pocprior, priorperiod);
pocprev.SetDefaultColor(Color.MAGENTA);
pocprev.SetPaintingStrategy(PaintingStrategy.POINTS);
pocprev.SetLineWeight(1);
pocprev.HideBubble();

plot valprev = GetValue(valprior, priorperiod);
valprev.SetDefaultColor(Color.MAGENTA);
valprev.SetPaintingStrategy(paintingStrategy = PaintingStrategy.HORIZONTAL);
valprev.SetLineWeight(1);
valprev.HideBubble();
Shareable Link: https://tos.mx/8RYZ99
Value Areas & Pivot Points by ShadowTrader
Code:
#------------------
#ShadowTrader VALUE AREA SCRIPT
#------------------
#http://shadowtrader.net/squawkfaq.pdf
#------------------
input VAHigh = 0.00;

input PointofControl = 0.00;

input VALow = 0.00;

input marketOpenTime = 0930;

input marketCloseTime = 1615;

input showcloud = yes;


def closeByPeriod = close(period = "DAY")[-1];

def openbyperiod = open(period = "DAY")[-1];

def VArea = if close >= VALow and close <= VAHigh then 1 else 0;

def secondsFromOpen = secondsFromTime(marketOpenTime);

def secondsTillClose = secondsTillTime(marketCloseTime);

def marketOpen = if secondsFromOpen >= 0 and secondsTillClose > 0 then yes else no;

def newDay = if !IsNaN(closeByPeriod) then 0 else 1;


plot VAH;

plot POC;

plot VAL;

if !IsNaN(close(period = "DAY")[-1])

then {

    VAH = Double.NaN;

    POC = Double.NaN;

    VAL = Double.NaN;

} else {

VAH = if marketOpen and newDay then VAHigh else double.nan;

POC = if marketOpen and newDay then pointofcontrol else double.nan;

VAL = if marketOpen and newDay then VALow else double.nan;

}

VAH.SetPaintingStrategy(paintingStrategy.line);

VAH.SetDefaultColor(color.darK_red);

VAH.SetLineWeight(2);

POC.SetPaintingStrategy(paintingStrategy.line);

POC.SetDefaultColor(color.DARK_ORANGE);

POC.SetLineWeight(2);

VAL.SetPaintingStrategy(paintingStrategy.line);

VAL.SetDefaultColor(color.darK_green);

VAL.SetLineWeight(2);


AddChartBubble (!IsNaN(VAH) and IsNaN(VAH[1]), VAH, "VAH", color.white, no);
AddChartBubble (!IsNaN(POC) and IsNaN(POC[1]), poc, "POC", color.white, no);
AddChartBubble (!IsNaN(VAL) and IsNaN(VAL[1]), val, "VAL", color.white, no);


plot cloudhigh = if marketOpen and newDay and showcloud then VAHigh else double.nan;

plot cloudlow = if marketOpen and newDay and showcloud then VALow else double.nan;

AddCloud (cloudhigh, cloudlow, color.yellow, color.yellow);

AddLabel(VArea, "In Value Area",  color.white);


#--------------------------------------
#NYSE AND NASDAQ BREADTH BUBBLE SCRIPT
#--------------------------------------

input length = 2;


#NYSE Breath ratio
def NYSEratio =  if (close("$UVOL") >= close("$DVOL")) then (close("$UVOL") / close("$DVOL")) else -( close("$DVOL") / close("$UVOL")) ;
plot NYratio = round(NYSEratio, length);


NYratio.DefineColor("NYSEup", color.UpTICK);
NYratio.DefineColor("NYSEdown", color.DownTICK);
NYratio.AssignValueColor(if NYSEratio >= 0 then NYratio.color("NYSEup") else NYratio.color("NYSEdown"));

AddLabel(yes, concat(NYratio, " :1 NYSE"), (if NYSEratio >= 0 then NYratio.color("NYSEup") else NYratio.color("NYSEdown")));


#Nasdaq Breath ratio
def NASDratio =  if (close("$UVOL/Q") >= close("$DVOL/Q")) then (close("$UVOL/Q") / close("$DVOL/Q")) else -( close("$DVOL/Q") / close("$UVOL/Q")) ;
plot Qratio = round(NASDratio, length);

Qratio.DefineColor("NASup", color.UpTICK);
Qratio.DefineColor("NASdown", color.DownTICK);
Qratio.AssignValueColor(if NASDratio >= 0 then Qratio.color("NASup") else Qratio.color("NASdown"));

AddLabel(yes, concat(Qratio, " :1 NASD"), (if NASDratio >= 0 then Qratio.color("NASup") else Qratio.color("NASdown")));


#ZeroLine

plot zeroline = 0;
zeroline.assignValueColor(if NYSEratio > NYSEratio[1] then color.GREEN else color.RED);
zeroline.setLineWeight(1);
zeroline.hideTitle();
zeroline.hideBubble();
###################################################
Scanner
Rich (BB code):
# Scan for Price in value area and volume spike
# Mobius
# Chat Room Request 04.05.2018
def yyyymmdd = GetYYYYMMDD();
def day_number = DaysFromDate(First(yyyymmdd)) + GetDayOfWeek(First(yyyymmdd));
def period = Floor(day_number / 7);
def cond = 0 < period - period[1];
profile vol = VolumeProfile("startNewProfile" = cond, "onExpansion" = no);
vol.Show("va color" = Color.YELLOW);
def b = vol.GetHighestValueArea();
def a = vol.GetLowestValueArea();
plot condition = between(close, a, b) and volume > Average(volume, 21);
Pivot Levels
Code:
#######NexusOne code for pivot plus 3 levels of Support & Resistance####################
 #NexusOne: Also use this as a template source for code
#Mobius: the calculations for pivots are based on the prior days open high low and close. Nothing else.
input DynamicHide = {"No", default "Yes"};
input showOnlyToday = YES;
input Market_Open_Time = 0830;
input Market_Close_Time = 1616;


def h = DynamicHide;
def day = getDay();
def lastDay = getLastDay();
def isToday = if(day == lastDay, 1, 0);
def shouldPlot = if(showOnlyToday and isToday, 1, if(!showOnlyToday, 1, 0));

def pastOpen = if((secondsTillTime(Market_Open_Time) > 0), 0, 1);
def pastClose = if((secondsTillTime(Market_Close_Time) > 0), 0, 1);
def marketOpen = if(pastOpen and !pastClose, 1, 0);
def firstBar = if (day[1] != day, 1, 0);

def closingBell = if secondsTillTime(Market_Close_Time)[1] > 0 and
secondsTillTime(Market_Close_Time) <= 0 or
(secondsTillTime(Market_Close_Time)[1] < secondsTillTime(Market_Close_Time)
and secondsTillTime(Market_Close_Time)[1] > 0) then 1 else 0;

rec lclose = if IsNaN(close[-1]) then lclose[1] else close;
rec regHoursHigh = if(high > regHoursHigh[1] and marketOpen, high,
if(marketOpen and !firstBar, regHoursHigh[1], high));
rec regHoursLow = if(low < regHoursLow[1] and marketOpen, low,
if(marketOpen and regHoursLow[1] > 0 and !firstBar, regHoursLow[1], low));

rec runningClose = compoundValue(1, if closingbell then close[1] else runningClose[1], close);
rec prevClose = compoundValue(1, if closingBell then runningClose else prevClose[1], close);
rec prevHigh = compoundValue(1, if closingBell then regHoursHigh[1] else prevHigh[1], high);
rec prevLow = compoundValue(1, if closingBell then regHourslow[1] else prevlow[1], low);
rec prevHigh2 = compoundValue(1, if closingBell then prevHigh[1] else prevHigh2[1], high);
rec prevLow2 = compoundValue(1, if closingBell then prevLow[1] else prevlow2[1], low);


plot pivot = if shouldPlot then (prevHigh + prevClose + prevLow) / 3 else double.nan;
pivot.SetStyle(curve.FIRM);
pivot.SetDefaultColor(color.VIOLET);
pivot.HideBubble();


plot s1 = if shouldPlot then (2 * pivot) - prevHigh else double.nan;
s1.SetStyle(curve.FIRM);
s1.SetDefaultColor(color.dark_RED);
s1.HideBubble();

plot r1 = if shouldPlot then (2 * pivot) - prevLow else double.nan;
r1.SetStyle(curve.FIRM);
r1.SetDefaultColor(color.DaRK_GREEN);
r1.HideBubble();

plot r2 = if shouldPlot then pivot + ( r1 - s1) else double.nan;
r2.SetStyle(curve.FIRM);
r2.SetDefaultColor(color.DaRK_GREEN);
r2.HideBubble();

plot s2 = if shouldPlot then pivot - ( r1 - s1) else double.nan;
s2.SetStyle(curve.FIRM);
s2.SetDefaultColor(color.DaRK_RED);
s2.HideBubble();

plot s3 = if shouldPlot then prevLow - 2 * (prevHigh - pivot) else double.nan;
s3.SetStyle(curve.FIRM);
s3.SetDefaultColor(color.DaRK_RED);
s3.HideBubble();

plot r3 = if shouldPlot then prevHigh + 2 * (pivot - prevLow) else double.nan;
r3.SetStyle(curve.FIRM);
r3.SetDefaultColor(color.DaRK_GREEN);
r3.HideBubble();

pivot.setHiding(h and (lclose > r2 or lclose < s2));
r1.setHiding(h and lclose < s1);
r2.setHiding(h and lclose < r1);
r3.setHiding(h and lclose < r2);

s1.setHiding(h and lclose > r1);
s2.setHiding(h and lclose > s1);
s3.setHiding(h and lclose > s2);
#NexusOne: has a hide feature
######## EOC ##########
Attachments
Last edited by a moderator: