


This script is designed to model intraday market behavior through the lens of session-based liquidity, manipulation, and continuation. Instead of treating every candle or breakout equally, the indicator organizes the trading day into three major institutional sessions — Asia (Tokyo), London, and New York — and tracks how price behaves relative to each session’s highs and lows. The goal is to help identify whether the market is accumulating, manipulating liquidity, expanding directionally, or trapping traders before a larger move.
SESSION AUCTION BIAS ENGINE
London Intent → NY Confirmation Framework
This script is designed to model intraday market behavior through institutional session flow, liquidity transfer, and directional continuation. Rather than treating all breakouts, reversals, and momentum candles equally, the indicator organizes the trading day into three major market sessions — Asia (Tokyo), London, and New York — and interprets how price interacts with each session’s highs, lows, and accepted value areas.
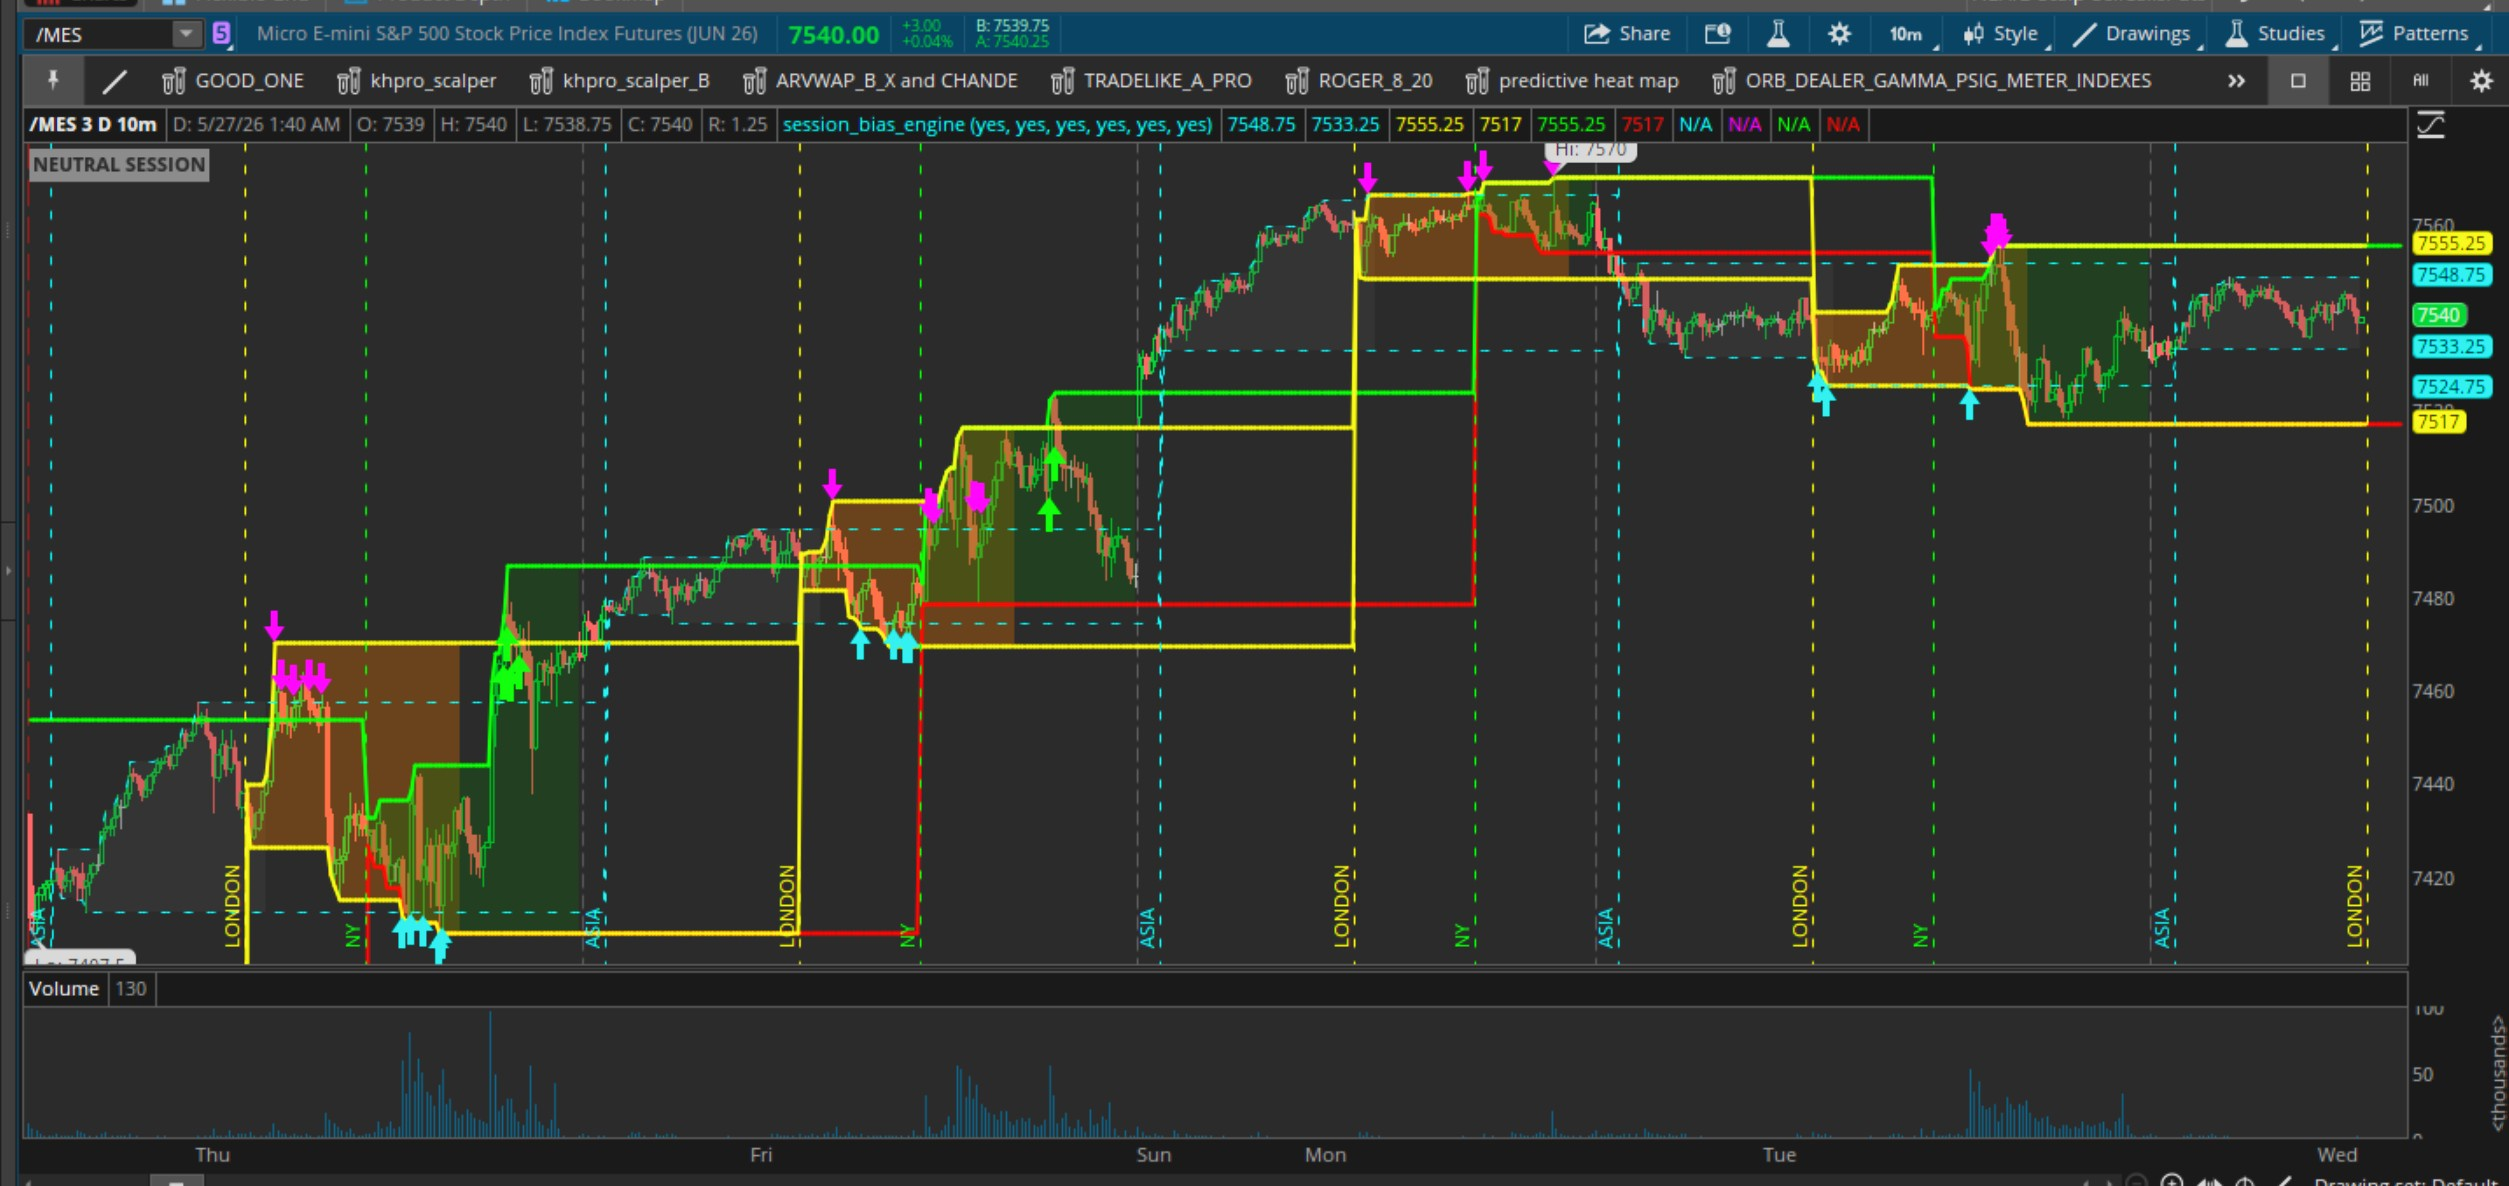
The framework is built around the idea that markets move through phases of balance, manipulation, intent revelation, and continuation. Instead of functioning as a traditional signal generator, the script acts as a market context and auction classification engine designed to help traders identify when institutions are accumulating inventory, trapping liquidity, confirming directional intent, or aggressively repricing the market.
CORE SESSION STRUCTURE
The script divides the trading day into three institutional sessions using EST time:
Each session continuously tracks:
SESSION THEORY
The framework assumes each session plays a different role in the daily auction process.
Asia Session — Balance / Inventory Building
Asia is generally treated as a balance or inventory-building session. Price often consolidates, compresses, or rotates within a relatively narrow range. The Asia high and low become important liquidity reference points for the rest of the trading day.
The script plots the Asia range in cyan/gray tones. This range acts as the initial reference for later London manipulation and New York continuation.
London Session — Intent Revelation
London is treated as the session where directional intent begins to emerge. London frequently:
London Sweep High
London trades above the Asia high but closes back below it. This often represents a failed breakout or liquidity sweep designed to trap breakout buyers.
London Sweep Low
London trades below the Asia low but reclaims back above it. This often signals seller exhaustion or trapped shorts.
London Bull Intent
London breaks above the Asia high with:
London Bear Intent
London breaks below the Asia low with:
Once established, London intent is “locked” into the system and carried forward into the New York session.
NEW YORK SESSION — CONFIRMATION OR FAILURE
The New York session determines whether London’s directional intent was valid or whether it fails.
This is one of the most important concepts in the framework.
New York does not simply create random movement — it confirms or rejects London’s auction.
MARKET PROFILES
The system classifies the day into several major profiles.
NY CONTINUATION PROFILE
A continuation profile occurs when New York confirms London’s directional move.
Bullish Continuation
Conditions:
Bearish Continuation
Conditions:
DEATH PROFILE (IMPORTANT)
The Death Profile is the centerpiece bearish continuation model of the framework.
It is NOT a reversal pattern.
The Death Profile occurs when:
Visually, the script highlights Death Profiles using strong bearish markers and red continuation clouds to indicate persistent downside pressure.
These are typically the strongest bearish trend days.
POWER PROFILE
The bullish equivalent of the Death Profile is the Power Profile.
This occurs when:
This represents aggressive bullish repricing and institutional upside continuation.
FAILED AUCTIONS / REVERSALS
The framework also tracks failed London intent.
Examples:
These failed continuation structures often become reversal or trap days.
VISUAL INTERPRETATION
The chart is organized into a visual hierarchy designed to simplify market interpretation.
Session Clouds
Colored clouds visually define the active session ranges:
These clouds help identify balance, expansion, and accepted value.
Arrows
Arrows identify:
Green and red arrows represent directional continuation.
Squares
Squares identify confirmed continuation profiles:
Labels
Labels summarize the active market condition:
VWAP INTERPRETATION
VWAP is integrated as a directional acceptance filter.
Above VWAP
BEST USAGE
The script works best as a:
It is designed to answer:
IDEAL INTEGRATIONS
The framework becomes significantly stronger when combined with:
The goal is identifying:
SESSION AUCTION BIAS ENGINE
London Intent → NY Confirmation Framework
This script is designed to model intraday market behavior through institutional session flow, liquidity transfer, and directional continuation. Rather than treating all breakouts, reversals, and momentum candles equally, the indicator organizes the trading day into three major market sessions — Asia (Tokyo), London, and New York — and interprets how price interacts with each session’s highs, lows, and accepted value areas.
The framework is built around the idea that markets move through phases of balance, manipulation, intent revelation, and continuation. Instead of functioning as a traditional signal generator, the script acts as a market context and auction classification engine designed to help traders identify when institutions are accumulating inventory, trapping liquidity, confirming directional intent, or aggressively repricing the market.
CORE SESSION STRUCTURE
The script divides the trading day into three institutional sessions using EST time:
| Session | Time |
|---|---|
| Asia (Tokyo) | 7:00 PM – 4:00 AM EST |
| London | 3:00 AM – 12:00 PM EST |
| New York | 8:00 AM – 5:00 PM EST |
Each session continuously tracks:
- session high
- session low
- session midpoint
- directional acceptance/rejection
SESSION THEORY
The framework assumes each session plays a different role in the daily auction process.
Asia Session — Balance / Inventory Building
Asia is generally treated as a balance or inventory-building session. Price often consolidates, compresses, or rotates within a relatively narrow range. The Asia high and low become important liquidity reference points for the rest of the trading day.
The script plots the Asia range in cyan/gray tones. This range acts as the initial reference for later London manipulation and New York continuation.
London Session — Intent Revelation
London is treated as the session where directional intent begins to emerge. London frequently:
- sweeps Asia highs/lows
- traps early positioning
- creates liquidity grabs
- initiates directional expansion
London Sweep High
London trades above the Asia high but closes back below it. This often represents a failed breakout or liquidity sweep designed to trap breakout buyers.
London Sweep Low
London trades below the Asia low but reclaims back above it. This often signals seller exhaustion or trapped shorts.
London Bull Intent
London breaks above the Asia high with:
- expansion
- strong volume
- VWAP acceptance
London Bear Intent
London breaks below the Asia low with:
- bearish expansion
- strong volume
- VWAP rejection
Once established, London intent is “locked” into the system and carried forward into the New York session.
NEW YORK SESSION — CONFIRMATION OR FAILURE
The New York session determines whether London’s directional intent was valid or whether it fails.
This is one of the most important concepts in the framework.
New York does not simply create random movement — it confirms or rejects London’s auction.
MARKET PROFILES
The system classifies the day into several major profiles.
NY CONTINUATION PROFILE
A continuation profile occurs when New York confirms London’s directional move.
Bullish Continuation
Conditions:
- London established bullish intent
- New York holds above London highs
- Price remains above VWAP
- Expansion continues
Bearish Continuation
Conditions:
- London established bearish intent
- New York breaks lower
- Price remains below VWAP
- Selling pressure continues
DEATH PROFILE (IMPORTANT)
The Death Profile is the centerpiece bearish continuation model of the framework.
It is NOT a reversal pattern.
The Death Profile occurs when:
- London establishes aggressive bearish intent
- Price breaks below the Asia range
- Selling expands with volume
- New York confirms and continues the downside auction
- VWAP remains overhead and rejected
- institutional liquidation
- downside acceptance
- trapped longs
- persistent sell pressure
- trend continuation
Visually, the script highlights Death Profiles using strong bearish markers and red continuation clouds to indicate persistent downside pressure.
These are typically the strongest bearish trend days.
POWER PROFILE
The bullish equivalent of the Death Profile is the Power Profile.
This occurs when:
- London establishes bullish intent
- Price expands above the Asia range
- New York confirms continuation
- VWAP remains supportive
- Buyers maintain directional control
This represents aggressive bullish repricing and institutional upside continuation.
FAILED AUCTIONS / REVERSALS
The framework also tracks failed London intent.
Examples:
- London bearish intent fails and New York reclaims above VWAP
- London bullish intent fails and New York collapses below VWAP
These failed continuation structures often become reversal or trap days.
VISUAL INTERPRETATION
The chart is organized into a visual hierarchy designed to simplify market interpretation.
Session Clouds
Colored clouds visually define the active session ranges:
- Asia = gray/cyan
- London = orange/yellow
- New York = green/red
These clouds help identify balance, expansion, and accepted value.
Arrows
Arrows identify:
- liquidity sweeps
- London intent triggers
- directional continuation
Green and red arrows represent directional continuation.
Squares
Squares identify confirmed continuation profiles:
- red squares = Death Profile
- green squares = Power Profile
Labels
Labels summarize the active market condition:
- SESSION NEUTRAL
- LONDON BEAR INTENT ACTIVE
- NY CONTINUATION BULL
- DEATH PROFILE
- POWER PROFILE
- FAILED REVERSAL
VWAP INTERPRETATION
VWAP is integrated as a directional acceptance filter.
Above VWAP
- bullish acceptance
- buyers in control
- upside continuation more likely
- bearish acceptance
- sellers in control
- downside continuation more likely
BEST USAGE
The script works best as a:
- market context engine
- auction framework
- session continuation model
It is designed to answer:
- Which side controls the auction?
- Is London revealing true intent?
- Is New York confirming or rejecting that intent?
- Is the market balanced or repricing?
- 5-minute
- 10-minute
- 15-minute
- 30-minute charts
IDEAL INTEGRATIONS
The framework becomes significantly stronger when combined with:
- VWAP / AVWAP
- Darvas structure
- Fair Value Gaps (FVG)
- Volume participation
- Expansion/compression logic
- Trap reclaim systems
- EMA structure
The goal is identifying:
- acceptance
- rejection
- continuation
- failed auctions
- institutional directional intent
Code:
#=========================================================
# SESSION AUCTION BIAS ENGINE
# Asia Range → London Intent → NY Continuation / Death Profile
# ANTWERKS FRAMEWORK
#=========================================================

declare upper;

#========================
# INPUTS
#========================
input showAsia = yes;
input showLondon = yes;
input showNY = yes;
input showClouds = yes;
input showLabels = yes;
input showSignals = yes;
input showVerticalLines = yes;

input volLength = 20;
input expansionLength = 20;
input expansionMultiplier = 1.20;

#========================
# SESSION TIMES EST
#========================
def asiaStart = 1900;
def asiaEnd   = 0400;

def londonStart = 0300;
def londonEnd   = 1200;

def nyStart = 0800;
def nyEnd   = 1700;

#========================
# SESSION DETECTION
#========================
def asiaSession =
    SecondsFromTime(asiaStart) >= 0 or
    SecondsTillTime(asiaEnd) > 0;

def londonSession =
    SecondsFromTime(londonStart) >= 0 and
    SecondsTillTime(londonEnd) > 0;

def nySession =
    SecondsFromTime(nyStart) >= 0 and
    SecondsTillTime(nyEnd) > 0;

def newAsia = asiaSession and !asiaSession[1];
def newLondon = londonSession and !londonSession[1];
def newNY = nySession and !nySession[1];

#========================
# CORE
#========================
def c = close;
def o = open;
def h = high;
def l = low;
def v = volume;

def avgVol = Average(v, volLength);
def strongVol = v > avgVol;

def barRange = h - l;
def avgRange = Average(TrueRange(h, c, l), expansionLength);

def bullExpansion =
    c > o and
    barRange > avgRange * expansionMultiplier and
    strongVol;

def bearExpansion =
    c < o and
    barRange > avgRange * expansionMultiplier and
    strongVol;

def vwapLine = VWAP();
def aboveVWAP = c > vwapLine;
def belowVWAP = c < vwapLine;

#========================
# ASIA HIGH / LOW
#========================
rec asiaHigh =
    if newAsia then h
    else if asiaSession then Max(h, asiaHigh[1])
    else asiaHigh[1];

rec asiaLow =
    if newAsia then l
    else if asiaSession then Min(l, asiaLow[1])
    else asiaLow[1];

def asiaMid = (asiaHigh + asiaLow) / 2;

#========================
# LONDON HIGH / LOW
#========================
rec londonHigh =
    if newLondon then h
    else if londonSession then Max(h, londonHigh[1])
    else londonHigh[1];

rec londonLow =
    if newLondon then l
    else if londonSession then Min(l, londonLow[1])
    else londonLow[1];

def londonMid = (londonHigh + londonLow) / 2;

#========================
# NY HIGH / LOW
#========================
rec nyHigh =
    if newNY then h
    else if nySession then Max(h, nyHigh[1])
    else nyHigh[1];

rec nyLow =
    if newNY then l
    else if nySession then Min(l, nyLow[1])
    else nyLow[1];

#========================
# LONDON INTENT
#========================

# London sweeps Asia high and rejects back below it
def londonSweepAsiaHigh =
    londonSession and
    h > asiaHigh[1] and
    c < asiaHigh[1];

# London sweeps Asia low and reclaims back above it
def londonSweepAsiaLow =
    londonSession and
    l < asiaLow[1] and
    c > asiaLow[1];

# London bearish intent = London breaks Asia low with expansion
def londonBearIntent =
    londonSession and
    c < asiaLow[1] and
    bearExpansion and
    belowVWAP;

# London bullish intent = London breaks Asia high with expansion
def londonBullIntent =
    londonSession and
    c > asiaHigh[1] and
    bullExpansion and
    aboveVWAP;

# Persist London intent into NY
rec londonBearIntentLocked =
    if newAsia then 0
    else if londonBearIntent then 1
    else londonBearIntentLocked[1];

rec londonBullIntentLocked =
    if newAsia then 0
    else if londonBullIntent then 1
    else londonBullIntentLocked[1];

#========================
# NY CONFIRMATION
#========================

def nyBearContinuation =
    nySession and
    londonBearIntentLocked and
    c < londonLow[1] and
    c < asiaLow[1] and
    belowVWAP;

def nyBullContinuation =
    nySession and
    londonBullIntentLocked and
    c > londonHigh[1] and
    c > asiaHigh[1] and
    aboveVWAP;

# Your clarified definition:
# Death Profile = London bearish + NY bearish continuation
def deathProfileBear =
    londonBearIntentLocked and
    nyBearContinuation;

# Bull version optional: London bullish + NY bullish continuation
def powerProfileBull =
    londonBullIntentLocked and
    nyBullContinuation;

# Reversal / trap profiles
def londonBearFailedNYReversal =
    nySession and
    londonBearIntentLocked and
    c > londonMid and
    aboveVWAP;

def londonBullFailedNYReversal =
    nySession and
    londonBullIntentLocked and
    c < londonMid and
    belowVWAP;

#========================
# CLOUD REFERENCES
#========================
def asiaHighCloud =
    if showClouds and asiaSession then asiaHigh else Double.NaN;

def asiaLowCloud =
    if showClouds and asiaSession then asiaLow else Double.NaN;

def londonHighCloud =
    if showClouds and londonSession then londonHigh else Double.NaN;

def londonLowCloud =
    if showClouds and londonSession then londonLow else Double.NaN;

def nyHighCloud =
    if showClouds and nySession then nyHigh else Double.NaN;

def nyLowCloud =
    if showClouds and nySession then nyLow else Double.NaN;

#========================
# SESSION CLOUDS
#========================
AddCloud(asiaHighCloud, asiaLowCloud, Color.DARK_GRAY, Color.DARK_GRAY);
AddCloud(londonHighCloud, londonLowCloud, Color.DARK_ORANGE, Color.DARK_ORANGE);
AddCloud(nyHighCloud, nyLowCloud, Color.DARK_GREEN, Color.DARK_GREEN);

# Death profile cloud
AddCloud(
    if deathProfileBear then h else Double.NaN,
    if deathProfileBear then l else Double.NaN,
    Color.RED,
    Color.RED
);

# Bull continuation cloud
AddCloud(
    if powerProfileBull then h else Double.NaN,
    if powerProfileBull then l else Double.NaN,
    Color.GREEN,
    Color.GREEN
);

#========================
# SESSION LEVEL PLOTS
#========================
plot AsiaHighPlot =
    if showAsia then asiaHigh else Double.NaN;
AsiaHighPlot.SetDefaultColor(Color.CYAN);
AsiaHighPlot.SetStyle(Curve.SHORT_DASH);

plot AsiaLowPlot =
    if showAsia then asiaLow else Double.NaN;
AsiaLowPlot.SetDefaultColor(Color.CYAN);
AsiaLowPlot.SetStyle(Curve.SHORT_DASH);

plot LondonHighPlot =
    if showLondon then londonHigh else Double.NaN;
LondonHighPlot.SetDefaultColor(Color.YELLOW);
LondonHighPlot.SetLineWeight(2);

plot LondonLowPlot =
    if showLondon then londonLow else Double.NaN;
LondonLowPlot.SetDefaultColor(Color.YELLOW);
LondonLowPlot.SetLineWeight(2);

plot NYHighPlot =
    if showNY then nyHigh else Double.NaN;
NYHighPlot.SetDefaultColor(Color.GREEN);
NYHighPlot.SetLineWeight(2);

plot NYLowPlot =
    if showNY then nyLow else Double.NaN;
NYLowPlot.SetDefaultColor(Color.RED);
NYLowPlot.SetLineWeight(2);

plot VWAPPlot = vwapLine;
VWAPPlot.SetDefaultColor(Color.MAGENTA);
VWAPPlot.SetLineWeight(2);

#========================
# SIGNAL MARKERS
#========================
plot LondonSweepLow =
    if showSignals and londonSweepAsiaLow then l else Double.NaN;
LondonSweepLow.SetPaintingStrategy(PaintingStrategy.ARROW_UP);
LondonSweepLow.SetDefaultColor(Color.CYAN);
LondonSweepLow.SetLineWeight(3);

plot LondonSweepHigh =
    if showSignals and londonSweepAsiaHigh then h else Double.NaN;
LondonSweepHigh.SetPaintingStrategy(PaintingStrategy.ARROW_DOWN);
LondonSweepHigh.SetDefaultColor(Color.MAGENTA);
LondonSweepHigh.SetLineWeight(3);

plot LondonBearIntentSignal =
    if showSignals and londonBearIntent then h else Double.NaN;
LondonBearIntentSignal.SetPaintingStrategy(PaintingStrategy.ARROW_DOWN);
LondonBearIntentSignal.SetDefaultColor(Color.RED);
LondonBearIntentSignal.SetLineWeight(4);

plot LondonBullIntentSignal =
    if showSignals and londonBullIntent then l else Double.NaN;
LondonBullIntentSignal.SetPaintingStrategy(PaintingStrategy.ARROW_UP);
LondonBullIntentSignal.SetDefaultColor(Color.GREEN);
LondonBullIntentSignal.SetLineWeight(4);

plot DeathProfileSignal =
    if showSignals and deathProfileBear then h else Double.NaN;
DeathProfileSignal.SetPaintingStrategy(PaintingStrategy.SQUARES);
DeathProfileSignal.SetDefaultColor(Color.RED);
DeathProfileSignal.SetLineWeight(5);

plot PowerBullSignal =
    if showSignals and powerProfileBull then l else Double.NaN;
PowerBullSignal.SetPaintingStrategy(PaintingStrategy.SQUARES);
PowerBullSignal.SetDefaultColor(Color.GREEN);
PowerBullSignal.SetLineWeight(5);

#========================
# LABELS
#========================
AddLabel(showLabels,
    if deathProfileBear then "DEATH PROFILE: LONDON BEAR + NY BEAR CONTINUATION"
    else if powerProfileBull then "POWER PROFILE: LONDON BULL + NY BULL CONTINUATION"
    else if londonBearFailedNYReversal then "NY REVERSAL: LONDON BEAR FAILED"
    else if londonBullFailedNYReversal then "NY REVERSAL: LONDON BULL FAILED"
    else if londonBearIntentLocked then "LONDON BEAR INTENT ACTIVE"
    else if londonBullIntentLocked then "LONDON BULL INTENT ACTIVE"
    else if londonSweepAsiaLow then "LONDON SWEEP ASIA LOW"
    else if londonSweepAsiaHigh then "LONDON SWEEP ASIA HIGH"
    else "SESSION NEUTRAL",
    if deathProfileBear then Color.RED
    else if powerProfileBull then Color.GREEN
    else if londonBearFailedNYReversal then Color.CYAN
    else if londonBullFailedNYReversal then Color.MAGENTA
    else if londonBearIntentLocked then Color.RED
    else if londonBullIntentLocked then Color.GREEN
    else if londonSweepAsiaLow then Color.CYAN
    else if londonSweepAsiaHigh then Color.MAGENTA
    else Color.GRAY
);

AddLabel(showLabels,
    "ASIA H/L: " + Round(asiaHigh, 2) + " / " + Round(asiaLow, 2) +
    " | LONDON H/L: " + Round(londonHigh, 2) + " / " + Round(londonLow, 2),
    Color.LIGHT_GRAY
);

#========================
# VERTICAL LINES
#========================
AddVerticalLine(showVerticalLines and SecondsFromTime(asiaStart) == 0, "ASIA", Color.CYAN);
AddVerticalLine(showVerticalLines and SecondsFromTime(londonStart) == 0, "LONDON", Color.YELLOW);
AddVerticalLine(showVerticalLines and SecondsFromTime(nyStart) == 0, "NY", Color.GREEN);
Last edited by a moderator:


