The Market Mover indicator is simple yet effective for day trading options and stocks. It's based on the idea of using a Simple Moving Average in combination with the RSI. The concept was introduced to me by another trader named Thanson Stevens. He called the study #Thandicator.
Before we begin, I want you to add the following to your chart:


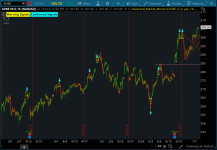
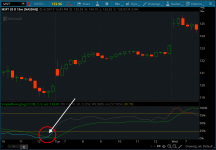
Those are just a few examples of when to go long on the stock.
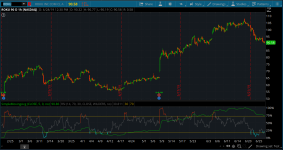
") At this point, you probably know what would trigger a short signal. When the RSI is crossing down on the 5 SMA while both lines are in the overbought zone or around there.
At this point, you probably know what would trigger a short signal. When the RSI is crossing down on the 5 SMA while both lines are in the overbought zone or around there.


A few warnings:


If you're looking for a ready-made indicator of the concept above, you're in luck! With the advanced version, you no longer have to zoom into your chart to see the crossover.
Here's the full list of features in the new version:
Before we begin, I want you to add the following to your chart:
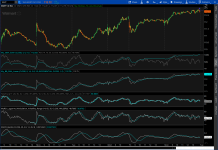
- 5 SMA (Simple Moving Average)
- RSI (default settings)
- Recommended time frame: 5m or higher
When to Buy
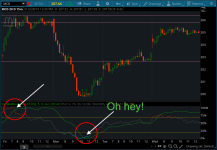
Think of this strategy as any other moving average crossover where you buy on the fast SMA crossing up on the slow SMA, except in this case we're using a 5 simple moving average and the Relative Strength Index indicator. A buy signal will be produced when the RSI is crossing up on the 5 SMA while both lines are in the oversold region or around there.Those are just a few examples of when to go long on the stock.
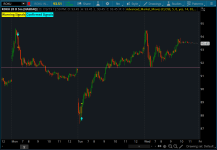
When to Short
Lucky for you, this strategy also works for shorting the market as well. That way you can make money on the way up and on the way down At this point, you probably know what would trigger a short signal. When the RSI is crossing down on the 5 SMA while both lines are in the overbought zone or around there.Why this strategy work
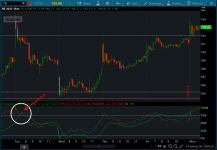
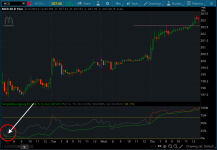
If you think about it, the 5 SMA acts as a trend following indicator while the RSI shows you the momentum of the stock. When both indicators combine forces, it truly produces some outstanding trade signals. I did mention earlier that day trading is ideal for this strategy but if you zoom out to the 30m, hourly, or even daily you can get some nice swing signals too.A few warnings:
- Just like any indicators and strategies we shared on this site, the Market Mover Indicator is not the holy grail. Be sure to backtest it with historical data.
- Due to the nature of ThinkorSwim, especially when you move an indicator designed to be on the upper chart to the lower chart, it messes up how ToS display it. For the crossover to be accurate, make sure you zoom into your chart rather than expanding it out. If you want to avoid this problem, see the advanced version below. ⚠
- Avoid any buy or sell signals created between the Overbought and Oversold regions.
The Advanced Version
If you're looking for a ready-made indicator of the concept above, you're in luck! With the advanced version, you no longer have to zoom into your chart to see the crossover.
Here's the full list of features in the new version:
- Scanner

- Alerts
- Backtesting capability
- Less false signals
- Stop loss line
- Works on the ThinkorSwim mobile app
- No scaling errors
- Continuous support and updates.
Attachments
Last edited: