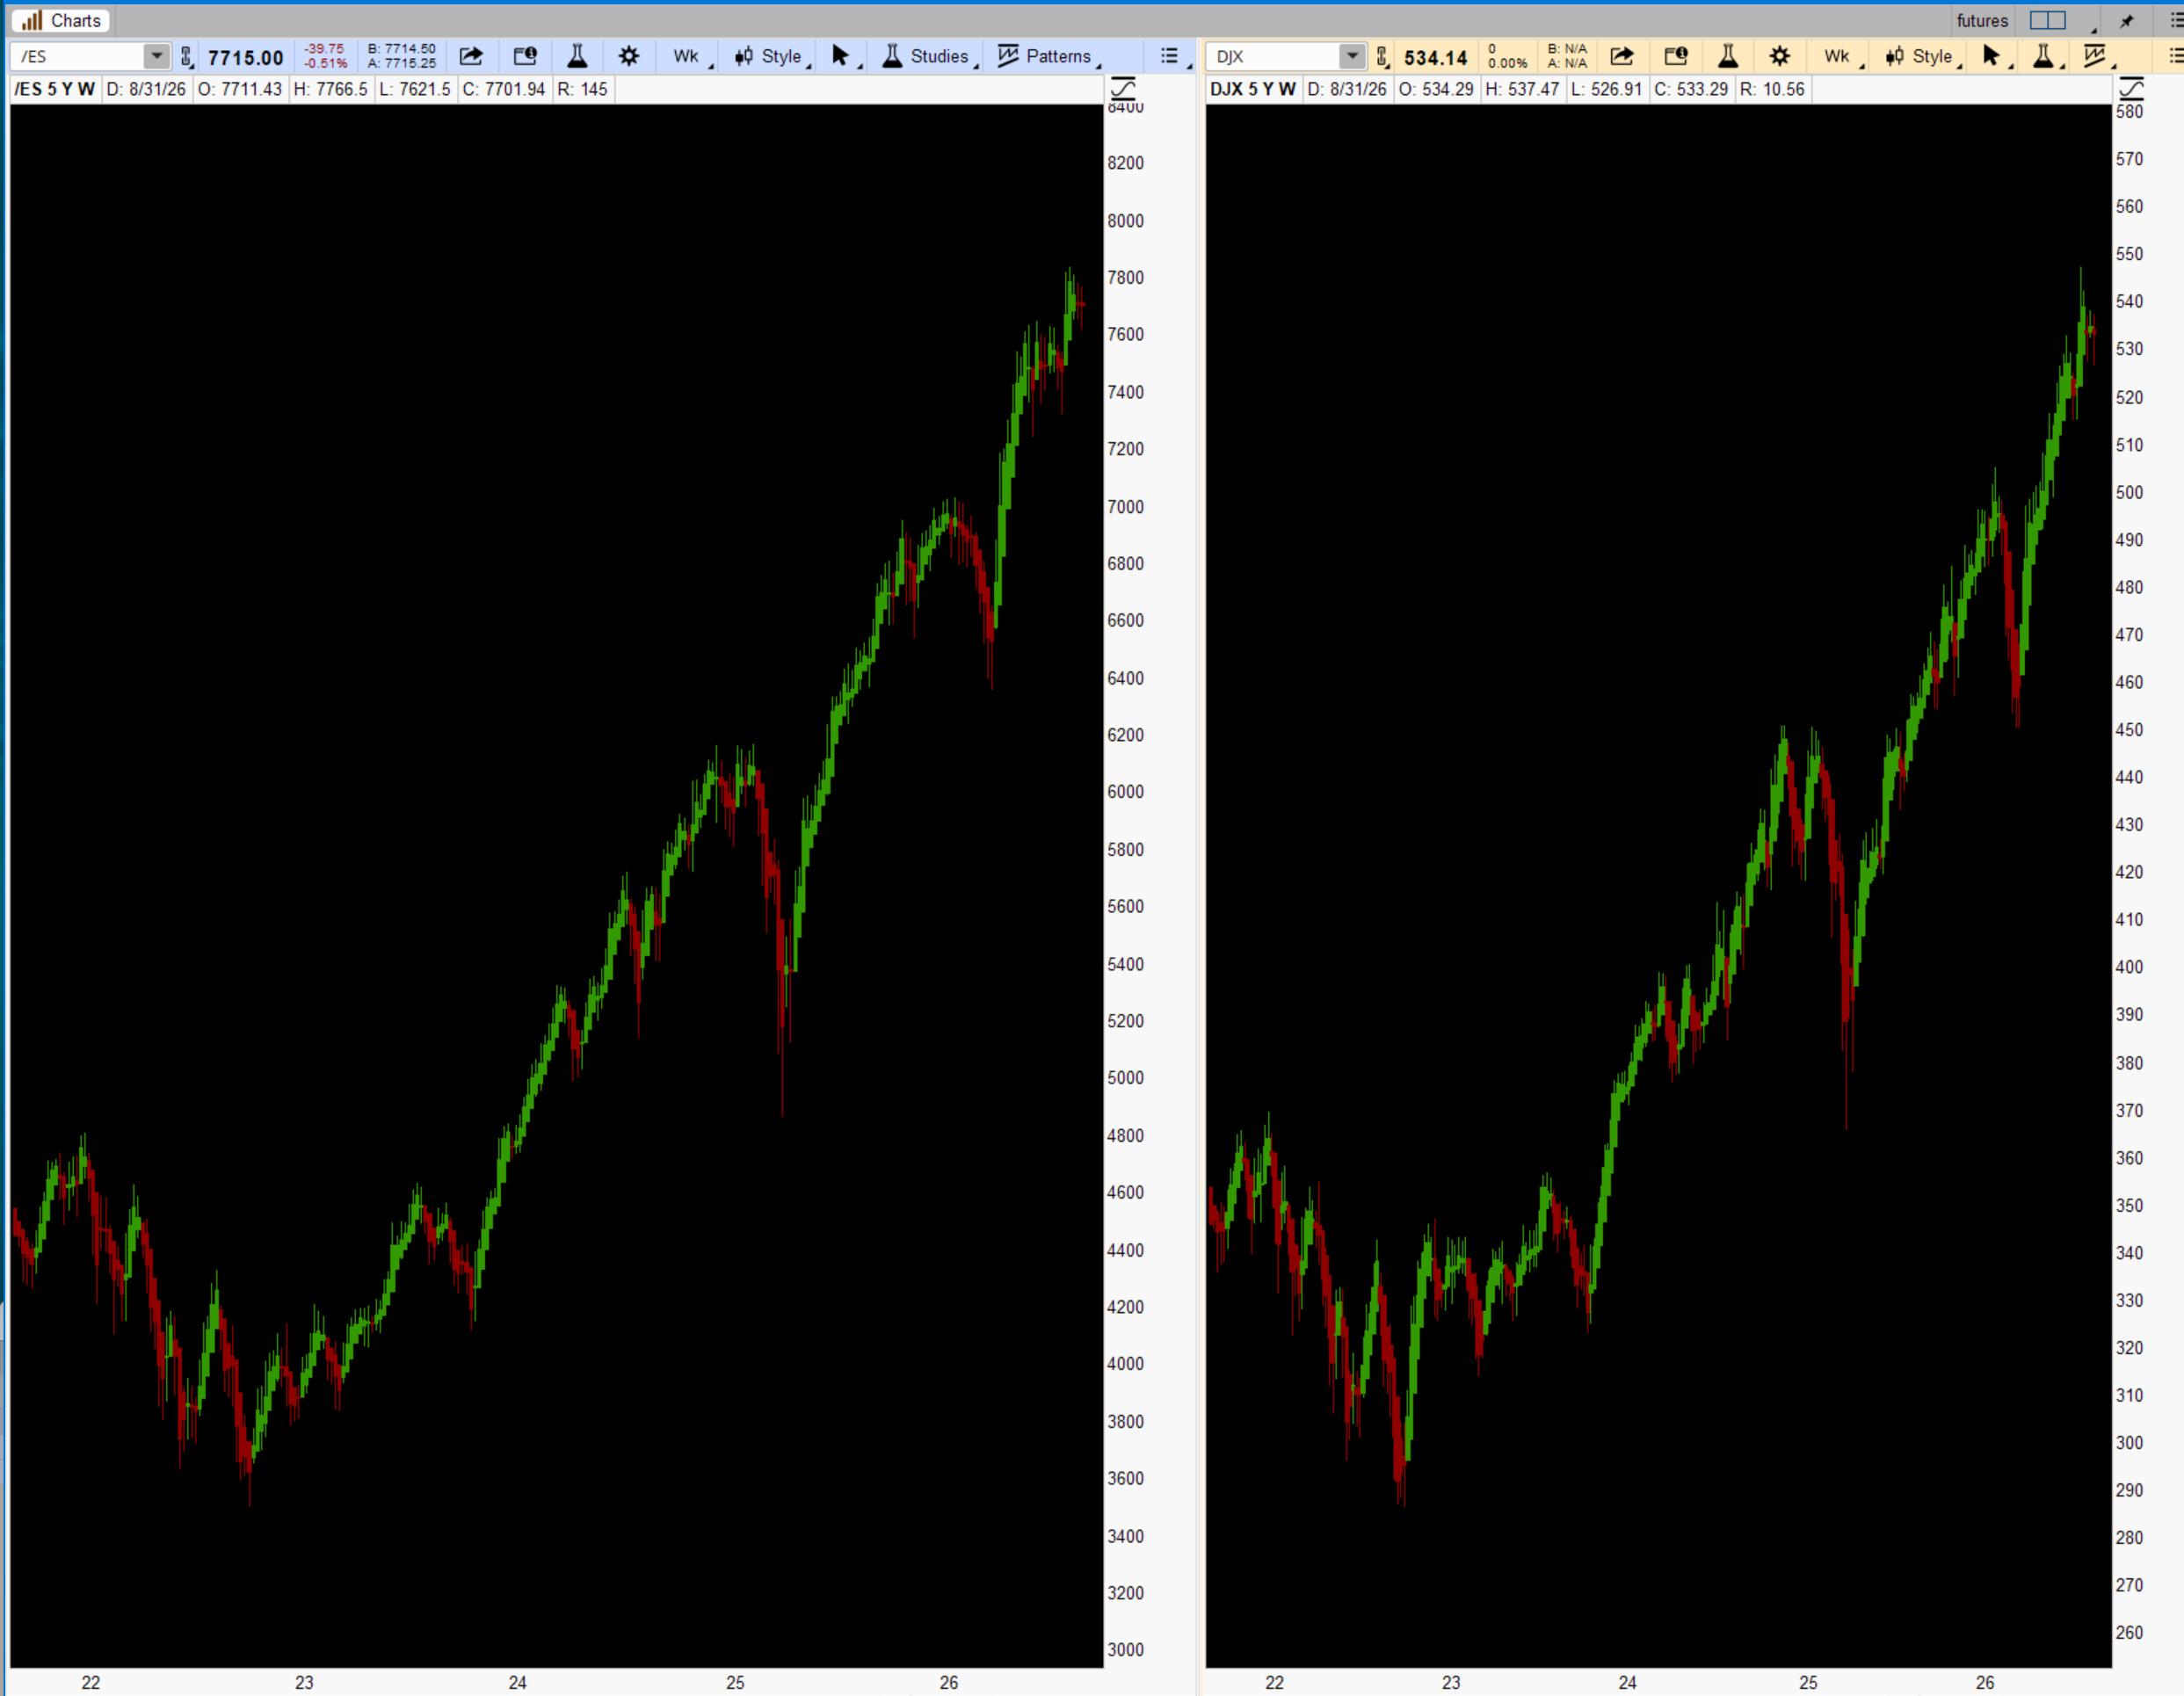
Market Crashing? I don't think so.
SPY fell only 0.38%, while QQQ and IWM finished positive. In a developing crash, correlations normally move toward one—large caps, technology, small caps, credit, and breadth begin falling together. That did not happen Friday. This was selective selling rather than indiscriminate liquidation.
The immediate catalyst was stronger employment, not rebalancing. August payrolls increased 162,000 versus approximately 56,000 expected, while unemployment remained 4.1%. The market interpreted “good economy” as potentially bad for interest rates: expectations for a September rate increase reportedly rose to about 58%. BLS employment report, Reuters market recap
Location: Valuations are elevated, yields are high, and the market is entering a seasonally volatile period. That creates correction vulnerability even without a recession.
Behavior: Positive QQQ and IWM performance alongside a slightly negative SPY suggests rotation beneath the index—not systemic liquidation.
Risk: The situation becomes materially more dangerous if SPY loses its daily 50-day average, failed rebounds form lower highs, breadth deteriorates, credit spreads widen, and volatility remains elevated rather than immediately fading.
Objective: As long as those breakdown conditions do not appear, weakness is more likely to become a tradable pullback, consolidation, or sector rotation than a crash.
For now, I would call this bullish structure under increasing rate and positioning pressure—not a confirmed crash setup.
SPY fell only 0.38%, while QQQ and IWM finished positive. In a developing crash, correlations normally move toward one—large caps, technology, small caps, credit, and breadth begin falling together. That did not happen Friday. This was selective selling rather than indiscriminate liquidation.
The immediate catalyst was stronger employment, not rebalancing. August payrolls increased 162,000 versus approximately 56,000 expected, while unemployment remained 4.1%. The market interpreted “good economy” as potentially bad for interest rates: expectations for a September rate increase reportedly rose to about 58%. BLS employment report, Reuters market recap
Where my explanation needs a tightening
- Inflation is not yet settled. The newest August PPI and CPI reports have not been released. PPI arrives September 10 and CPI September 11. Therefore, the market is trading the uncertainty surrounding those numbers—not confirmation that inflation remains neutral. BLS release calendar
- The 10-year remains a potential problem. Even though it backed away from its intraday high, it recently approached 4.8%. The direction over several days matters more than one afternoon decline. Persistent yields near or above that area would pressure valuations, particularly expensive growth stocks.
- September rebalancing is real, but it does not fully explain Friday. SPMO is the momentum fund you are probably thinking about. It reconstitutes and rebalances twice yearly on the third Fridays of March and September. Invesco SPMO methodology This year that September event is still ahead, so positioning may begin early, but the actual forced trading has not happened yet.
- “Dealers taking profits to make year-end look good” mixes different participants together. Portfolio managers may realize profits, reduce crowded holdings, or reposition ahead of reporting periods. Dealers generally hedge the option and inventory exposure created by customer orders; they do not ordinarily manage books to make annual fund performance look attractive.
Structure–Location–Behavior assessment
Structure: The broad market remains in its established bullish trend. One mildly negative S&P session does not alter that.Location: Valuations are elevated, yields are high, and the market is entering a seasonally volatile period. That creates correction vulnerability even without a recession.
Behavior: Positive QQQ and IWM performance alongside a slightly negative SPY suggests rotation beneath the index—not systemic liquidation.
Risk: The situation becomes materially more dangerous if SPY loses its daily 50-day average, failed rebounds form lower highs, breadth deteriorates, credit spreads widen, and volatility remains elevated rather than immediately fading.
Objective: As long as those breakdown conditions do not appear, weakness is more likely to become a tradable pullback, consolidation, or sector rotation than a crash.
My present judgment
- Immediate crash: Low probability
- Ordinary 3%–5% correction: Meaningful probability
- September volatility around CPI, the Fed, options expiration, and SPMO/index rebalancing: High probability
- Bull trend continuing after the volatility: Still the base case
For now, I would call this bullish structure under increasing rate and positioning pressure—not a confirmed crash setup.