
Can someone help me make this $TICK study easier to read?
Someone produced this for me upon request looking for a new set of TICK indicators, and I was pleasantly surprised with how much I love it. I was wondering if its at all possible to have the lines more spread apart so its easier to read? The lines are so close together when viewing it on a "normal" sized lower study. The best way to view it, I have found, is to make it really really big so you can make out the divergences and convergences easier. I even commented out the CumTick.SetLineWeight(3); to see if smaller lines would help, but no dice, really.

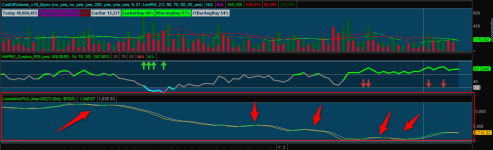
Here is how it looks when I blow it way up:

Was messing around with the cumulative tick lookback period, and seems to help some. Wasnt sure if anyone else had any good ideas?
Someone produced this for me upon request looking for a new set of TICK indicators, and I was pleasantly surprised with how much I love it. I was wondering if its at all possible to have the lines more spread apart so its easier to read? The lines are so close together when viewing it on a "normal" sized lower study. The best way to view it, I have found, is to make it really really big so you can make out the divergences and convergences easier. I even commented out the CumTick.SetLineWeight(3); to see if smaller lines would help, but no dice, really.
Here is how it looks when I blow it way up:
Was messing around with the cumulative tick lookback period, and seems to help some. Wasnt sure if anyone else had any good ideas?
Code:
#SKYNETGEN CTICK
#Can reset to start at beginning of Day, Week, Month, Year, Chart
#Thanks to futures.io @rmejia for similar code in VWAP_Bands
# interesting code fore rolling periods
#skynetgen: coloration and explicit signals

declare lower;
input TimeFrame = {default Day, Week, Month, Year, Chart};
input symbol = "$TICK";
def isInvalid = IsNan(hlc3(symbol));
def price = if (isInvalid, 0, hlc3(symbol));

def cap = GetAggregationPeriod();
def errorInAggregation =
    timeFrame == timeFrame.Day and cap >= AggregationPeriod.WEEK or
    timeFrame == timeFrame.Week and cap >= AggregationPeriod.MONTH;
Assert(!errorInAggregation, "timeFrame should be not less than current chart aggregation period");
def yyyyMmDd = GetYYYYMMDD();
def year = GetYear();
def periodIndx;
switch (timeFrame)
{
case Chart:
    periodIndx = 0;
case Day:
    periodIndx = yyyyMmDd;
case Week:
    periodIndx = Floor((daysFromDate(first(yyyyMmDd)) + getDayOfWeek(first(yyyyMmDd))) / 7);
case Month:
    periodIndx = roundDown(yyyyMmDd / 100, 0);
case Year:
    periodIndx = Floor(year - First(year));
}
def isPeriodRolled = CompoundValue(1, periodIndx != periodIndx[1], yes);
def cum;
if (isPeriodRolled)
{
    cum = price;
}
else
{
    cum = cum[1] + price;
}
plot CumTick = if isInvalid then Double.NaN else cum;
CumTick.SetPaintingStrategy(PaintingStrategy.Line);
#CumTick.SetLineWeight(3);
CumTick.DefineColor("PosAndUp", Color.Green);
CumTick.DefineColor("PosAndDn", Color.Orange);
CumTick.DefineColor("NegAndDn", Color.Red);
CumTick.DefineColor("NegAndUP", Color.orange);


CumTick.AssignValueColor(
    if Cumtick>0 then
       ( if cumtick>cumtick[1] then CumTick.color("PosAndUp") else CumTick.color("PosAndDN"))
    else
      ( if cumtick>cumtick[1] then CumTick.color("NegAndUp") else CumTick.color("NegAndDN")));
#CumTick.SetHiding(isInvalid);

plot zero = 0;
zero.AssignValueColor(GetColor(3)); zero.hidetitle();
plot avgtick=average(cumtick,3);
plot xup=if avgtick crosses above 0 then 0 else double.nan;
plot xdn=if avgtick crosses below 0 then 0 else double.nan;
xup.setpaintingStrategy(paintingStrategy.ARROW_UP);xup.hideTitle();
xdn.setpaintingStrategy(paintingStrategy.ARROW_DowN);xdn.hideTitle();
Attachments
Last edited:
 . If it still doesn't look good, mess around with the # of day(s) look back you have. For me, I got it to look the best (and accurate) at 5D:2M(min) with after hours turned off. So could above is still intact and unchanged.