I have re-worked the code for Magic Fibonacci 1.272 in this post. Please see that post for more background on this indicator, and its origination.
This update, version 2.0, has new logic to allow the indicator to show when the Extended session is visible and when the Extended session is not visible.
Sidebar: it took me a few iterations and some debugging to find the right conditions, and work around a few bugs/nuances in thinkscript around time. I will post another thread on that soon.
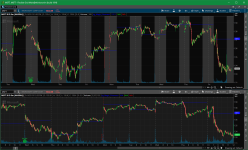
Here is an example of a flex grid with Extended hours visible and not visible. Notice the Magic Fibonacci 1.272 Indicators displays as expected on both charts.
Magic Fibonacci 1.272

Link to Flex Grid
https://tos.mx/nVqihA
Source Code for Magic Fibonacci 1.272
Disclaimers and Notices
You are free to use this code for personal use, and make derivative works from it. You are not granted permission to use this code (or derivative works) for commercial purposes which includes and is not limited to selling, reselling, or packaging with other commercial indicators. Headers and attribution in this code should remain as provided, and any derivative works should extend the existing headers.
This Fibonacci indicator was inspired by a day trader on Twitter (@pierhk). He traces his fibs "the unconventional way" by connecting the close of the previous day with the close of the first opening bar from the current trading day. He often does it on the 5m time frame to find resistance and use it as profit target.
This update, version 2.0, has new logic to allow the indicator to show when the Extended session is visible and when the Extended session is not visible.
Sidebar: it took me a few iterations and some debugging to find the right conditions, and work around a few bugs/nuances in thinkscript around time. I will post another thread on that soon.
Here is an example of a flex grid with Extended hours visible and not visible. Notice the Magic Fibonacci 1.272 Indicators displays as expected on both charts.
Magic Fibonacci 1.272
Link to Flex Grid
https://tos.mx/nVqihA
Source Code for Magic Fibonacci 1.272
Code:
# Magic Fibonacci 1.272
# Author: Kory Gill, @korygill
# Gap feature modfied by WalkingBallista
#
# VERSION HISTORY (sortable date and time (your local time is fine), and your initials
# 20190823-1300-KG    - fixed logic to find first bar of trading day
#                       so study works with extended sessions showing/not showing.
#                       Removed logic around gapUp/gapDown.
# ...
# ...
declare upper;
declare hide_on_daily;
declare once_per_bar;

def vClose = close;
def nan = Double.NaN;

# debug and extra indicator flags
# could make input variables, but that makes
# the study name longer, and most people
# probably want these off by default
def showPrevClose = 0;
def showOpen = 0;

# logic
def isRollover = GetYYYYMMDD() != GetYYYYMMDD()[1];
def beforeStart = GetTime() < RegularTradingStart(GetYYYYMMDD());
def afterEnd = GetTime() > RegularTradingEnd(GetYYYYMMDD());
def firstBarOfDay = if (beforeStart[1] == 1 and beforeStart == 0) or (isRollover and beforeStart == 0) then 1 else 0;
def lastBarOfDay = if
    (afterEnd[-1] == 1 and afterEnd == 0) or
    (isRollOver[-1] and firstBarOfDay[-1])
    then 1
    else 0;

def dayOpen = if firstBarOfDay then vClose else dayOpen[1];
def prevDayClose = if lastBarOfDay then vClose else prevDayClose[1];

# fibs
def delta = if firstBarOfDay then dayOpen - prevDayClose else delta[1];
def fib1272 = if firstBarOfDay then prevDayClose + delta * 1.272 else fib1272[1];

# colors, see https://usethinkscript.com/threads/rainbow-indicators-%E2%80%93-bb-and-moving-average.294/
#
# plots
# Plot nan on the bar before a new plot starts on firstBarOfDay.
# This causes the plot to draw without an annoying connecting line from
# one day to the next.
#
plot fib = if firstBarOfDay[-1] then nan else fib1272;
fib.SetDefaultColor(CreateColor(0,0,255));

plot pOpen = if showOpen and !firstBarOfDay[-1] then dayOpen else nan;
plot pPrevClose = if showPrevClose and !lastBarOfDay[-1] then prevDayClose else nan;
pOpen.SetDefaultColor(CreateColor(0,255,0));
pPrevClose.SetDefaultColor(CreateColor(255,0,0));
Disclaimers and Notices
You are free to use this code for personal use, and make derivative works from it. You are not granted permission to use this code (or derivative works) for commercial purposes which includes and is not limited to selling, reselling, or packaging with other commercial indicators. Headers and attribution in this code should remain as provided, and any derivative works should extend the existing headers.