Magic Fibonacci 1.272 Indicator for ThinkorSwim

Status
Not open for further replies.

BenTen

Administrative
Staff member
Staff
VIP
Lifetime
This indicator has been replaced with the Magic Fibonacci 1.272 Indicator for ThinkorSwim version 2
Find it here: https://usethinkscript.com/threads/magic-fibonacci-1-272-indicator-for-thinkorswim-v2.525/
This thread has been locked.

This Fibonacci indicator was inspired by a day trader on Twitter (@pierhk). He traces his fibs "the unconventional way" by connecting the close of the previous day with the close of the first opening bar from the current trading day. He often does it on the 5m timeframe to find resistance and use it as profit target.

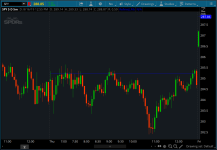
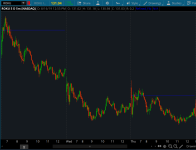
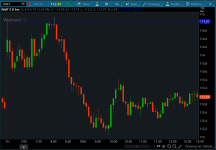
A few chart examples:

b0Ln7Th.png

TXwLDop.png

R1oEJfp.png


Before using this indicator, I recommend checking out some educational videos created by @pierhk to help you understand his thought process when tracing the Fibonacci extension 1.272.

thinkScript Code

Code:
# Magic Fibonacci 1.272
# Author: Kory Gill, @korygill
# Gap feature modfied by WalkingBallista

declare upper;
declare Hide_On_Daily;
declare once_per_bar;

def vClose = close;
def nan = Double.NaN;

# logic
def day = GetDay();
def firstBarOfDay = day != day[1];
def dayOpen = if firstBarOfDay then vClose else dayOpen[1];
def prevDayClose = if firstBarOfDay[-1] then vClose else prevDayClose[1];

# Gap feature added by @korygill and modified by @WalkingBallista
# track data necessary to calculate if this is a gapUp or gapDown day
def time = GetDay();
def previousClose = if time != time[1] then close[1] else previousClose[1];
def dayOpen1 = if time != time[1] then open else dayOpen1[1];
def dayLow = if time != time[1] then low else dayLow[1];
def dayHigh = if time != time[1] then high else dayHigh[1];
def gapUp = if dayLow > previousClose then 1 else 0;
def gapDown = if dayHigh < previousClose then 1 else 0;

# fibs
def delta = dayOpen - prevDayClose;
def fib000 = prevDayClose;
def fib1272 = prevDayClose + delta * 1.272;

# colors, see https://usethinkscript.com/threads/rainbow-indicators-%E2%80%93-bb-and-moving-average.294/
def pFib1272 = if firstBarOfDay[-1] then nan else fib1272;
plot fib = if gapUp then pFib1272 else double.NaN;
fib.SetDefaultColor(CreateColor(0,0,255));
plot fibGapDown = if gapDown then pFib1272 else double.NaN;
fibGapDown.SetDefaultColor(CreateColor(0,0,255));

Shareable Link

https://tos.mx/ENYa0i
Credits:
 

Attachments

  • b0Ln7Th.png
    b0Ln7Th.png
    75.4 KB · Views: 301
  • TXwLDop.png
    TXwLDop.png
    61 KB · Views: 274
  • R1oEJfp.png
    R1oEJfp.png
    71.2 KB · Views: 298
Last edited by a moderator:
@BenTen. I have watched several of his videos. Have you found the one in which he explains the rationale for doing this? In addition, his fibs indicator seems to be plotting more than just the 1.272 target. Do you have the code for his fibs plot by any chance? Thank you.
 
@john3 Aside from the fact that it’s a sq root of the other fib like @tenacity11 mentioned earlier I have yet too see any other. The guy drew his Fibs manually using the Fib drawing tool which usually also plot other Fiboacci. But his main focus is always on the 1.272 I believe.
 
Last edited by a moderator:
Status
Not open for further replies.

Join useThinkScript to post your question to a community of 21,000+ developers and traders.

Similar threads

Not the exact question you're looking for?

Start a new thread and receive assistance from our community.

87k+ Posts
320 Online
Create Post

Similar threads

Similar threads

The Market Trading Game Changer

Join 2,500+ subscribers inside the useThinkScript VIP Membership Club
  • Exclusive indicators
  • Proven strategies & setups
  • Private Discord community
  • ‘Buy The Dip’ signal alerts
  • Exclusive members-only content
  • Add-ons and resources
  • 1 full year of unlimited support

Frequently Asked Questions

What is useThinkScript?

useThinkScript is the #1 community of stock market investors using indicators and other tools to power their trading strategies. Traders of all skill levels use our forums to learn about scripting and indicators, help each other, and discover new ways to gain an edge in the markets.

How do I get started?

We get it. Our forum can be intimidating, if not overwhelming. With thousands of topics, tens of thousands of posts, our community has created an incredibly deep knowledge base for stock traders. No one can ever exhaust every resource provided on our site.

If you are new, or just looking for guidance, here are some helpful links to get you started.

What are the benefits of VIP Membership?
VIP members get exclusive access to these proven and tested premium indicators: Buy the Dip, Advanced Market Moves 2.0, Take Profit, and Volatility Trading Range. In addition, VIP members get access to over 50 VIP-only custom indicators, add-ons, and strategies, private VIP-only forums, private Discord channel to discuss trades and strategies in real-time, customer support, trade alerts, and much more. Learn all about VIP membership here.
How can I access the premium indicators?
To access the premium indicators, which are plug and play ready, sign up for VIP membership here.
Back
Top